Öræfajökull, (Figure 1) is one of the most dangerous volcanoes in Iceland and has produced the largest historical eruption in 1362. The large ice-covered volcano tucked away on the southeast coast of Iceland distant from the more active and “famous” rift-zone volcanoes is often referred to as an “unknown sleeping giant” where it rises 2100 m above sea level at the southern tip of Iceland’s largest glacier, Vattnajökull.
Rather little is known about this volcano due to its upper half being completely covered in ice where a 3x5 km caldera at the summit is covered by over half a kilometer of ice. This relatively peaceful volcano sat quietly for hundreds of years until 2014 when there was a short and small seismic outburst (Figure 2). Soon after, beginning in 2016-2017 and lasting through 2019, Öræfajökull started showing significant signs of unrest, where the volcano produced geothermal outflow, an ice cauldron on the glacial surface, and about 4000 earthquakes in a two-year period. Additionally, the volcano exhibited ~60 mm of inflation during the same time.
Due to this unprecedented “awakening” of Öræfajökull, the Icelandic Met Office along with research institutes rushed to install monitoring devices to capture all the new activity. Of note, were the four seismic stations donated and installed by Uppsala University from Sweden to help monitor the volcano.

Figure 1: Image of Öræfajökull (photo credit: Dave McGarvie, Lancaster University)
The rush to capture this rare data was twofold, one for civil protection matters in case the volcano was going to erupt or to detect secondary hazards, such as jökulhlaups, and two, to finally conduct a proper study of the internal structure. When Öræfajökull showed signs of less intense unrest in late 2019, there was excitement and disappointment. Excitement from the volcano not producing a destructive eruption, as well as the amount of data collected, and disappointment because COVID regulations came into effect. These regulations meant travel restrictions and work stoppages that prevented the ability to collect the data from all the temporary sensors deployed on the volcano. When travel bans were finally lifted and access to the volcano was possible again, the ability to receive the data was accomplished.

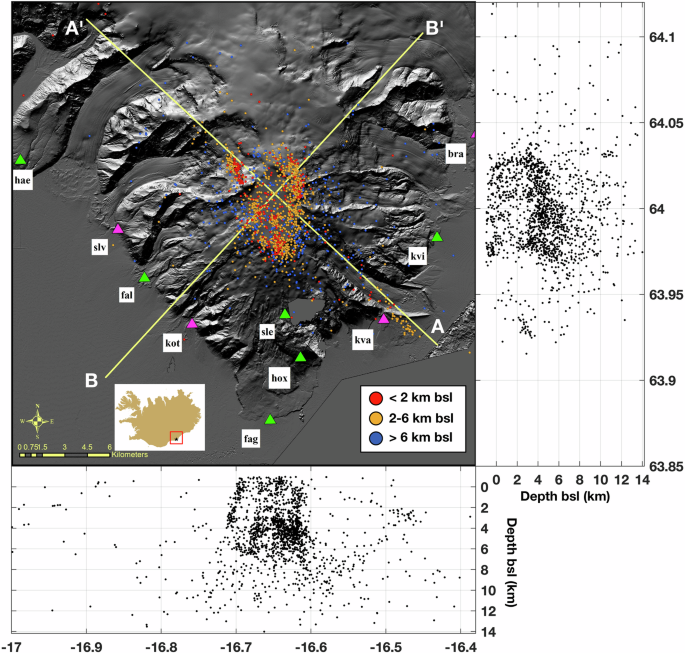
After years of waiting on the data, processing and implementations of modeling were finally able to be conducted. To best make use of all the data collected, the team decided to combine a local earthquake tomography (LET) model with geodetic modelling to try and understand the structure of Öræfajökull during the peak unrest timeframe (Figure 2). The LET discovered that there were three structural zones underneath the caldera. In the first 2 km below-sea-level (bsl) there was a geothermally active system. Between about 2-6 km bsl there was a low velocity, high Vp/Vs zone, where there was a theorized magma domain or melt zone (Figure 3). Below this zone, there were higher-velocity intrusive rocks. The geodetic modeling paired well with the seismic results in that the best-fit Mogi model placed the source of inflation at the same location as the low velocity, high Vp/Vs area at a depth of ~3.7 km bsl.

Figure 3. The Vp/Vs ratio (ratio of the P-wave velocity above the S-wave velocity) is a diagnostic tool for determining the presence of partial melt and other fluids in the rock. a) shows a south-north cross section through Öræfajökull with the thin red isoline showing the region of high Vp/Vs ratio that is indicative of the presence of (partial) melt. b) shows a slice through the model at 3-4 km depth showing the region with highest Vp/Vs ratios. The red dot in both a) and b) shows the position of the best fitting Mogi source. The dashed line shows the location of the cross section.
The data collected and results of this research are the first steps in building a history of unrest and risk assessment before the unthinkable happens. Similar to Eyjafjallajökull, where there were 18 years of on and off unrest before the large eruption in 2010, the unrest at Öræfajökull might just be the beginning of a larger sequence. If Öræfajökull erupts the likelihood of a significantly large eruption is very high, due to the larger proportions of silicic and intermediate melts the volcano possesses. If the eruption is comparable to the 1362 event, there easily could be global consequences.
Ultimately, this research highlights the need to monitor, research, and take notice of large ice-covered volcanoes, especially in the age of global warming where glacial unloading could potentially increase the threat of an eruption.
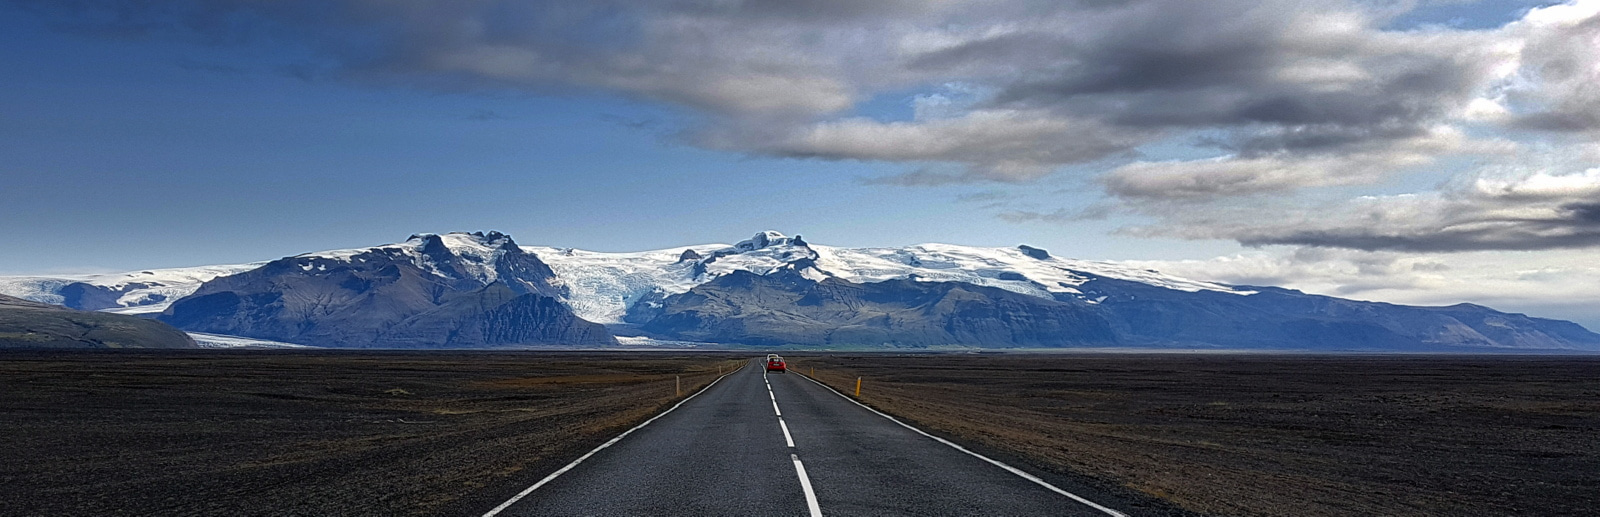
Poster Image: "The road to Öræfajökull" (Dave McGarvie, Lancaster University)
Follow the Topic
-
Communications Earth & Environment
An open access journal from Nature Portfolio that publishes high-quality research, reviews and commentary in the Earth, environmental and planetary sciences.

Related Collections
With Collections, you can get published faster and increase your visibility.
Hazards in Mountain Regions
Publishing Model: Open Access
Deadline: Nov 02, 2026
Ecosystems under marine heatwaves
Publishing Model: Hybrid
Deadline: Oct 22, 2026

Please sign in or register for FREE
If you are a registered user on Research Communities by Springer Nature, please sign in