Nat Nano:3D FET for intra/inter-cellular recording
Published in Bioengineering & Biotechnology

Here we describe a scalable and customizable sensing platform that enables accurate recording of transmembrane potentials in electrogenic cells. (https://doi.org/10.1038/s41565-021-01040-w led by Prof. S Xu) The platform employs a three-dimensional (3D) high-performance field-effect transistor (FET) array on an elastomeric substrate to enable minimally invasive cellular interfacing, producing faithful recordings as validated by the gold standard patch-clamp. Leveraging the high spatial and temporal resolutions of the FETs, we directly measure, for the first time, the intracellular signal conduction velocity of a cardiomyocyte (0.182 m·s-1), which is about five times the intercellular conduction velocity reported previously. We also demonstrate for the first time intracellular recordings of cardiomyocytes in cardiac muscle tissue constructs and reveal the signal conduction paths. This platform technology will provide new capabilities in probing electrical behaviors of single cells and cellular networks, which carries broad implications for understanding cellular physiology, disease pathology, and cell-cell interactions.
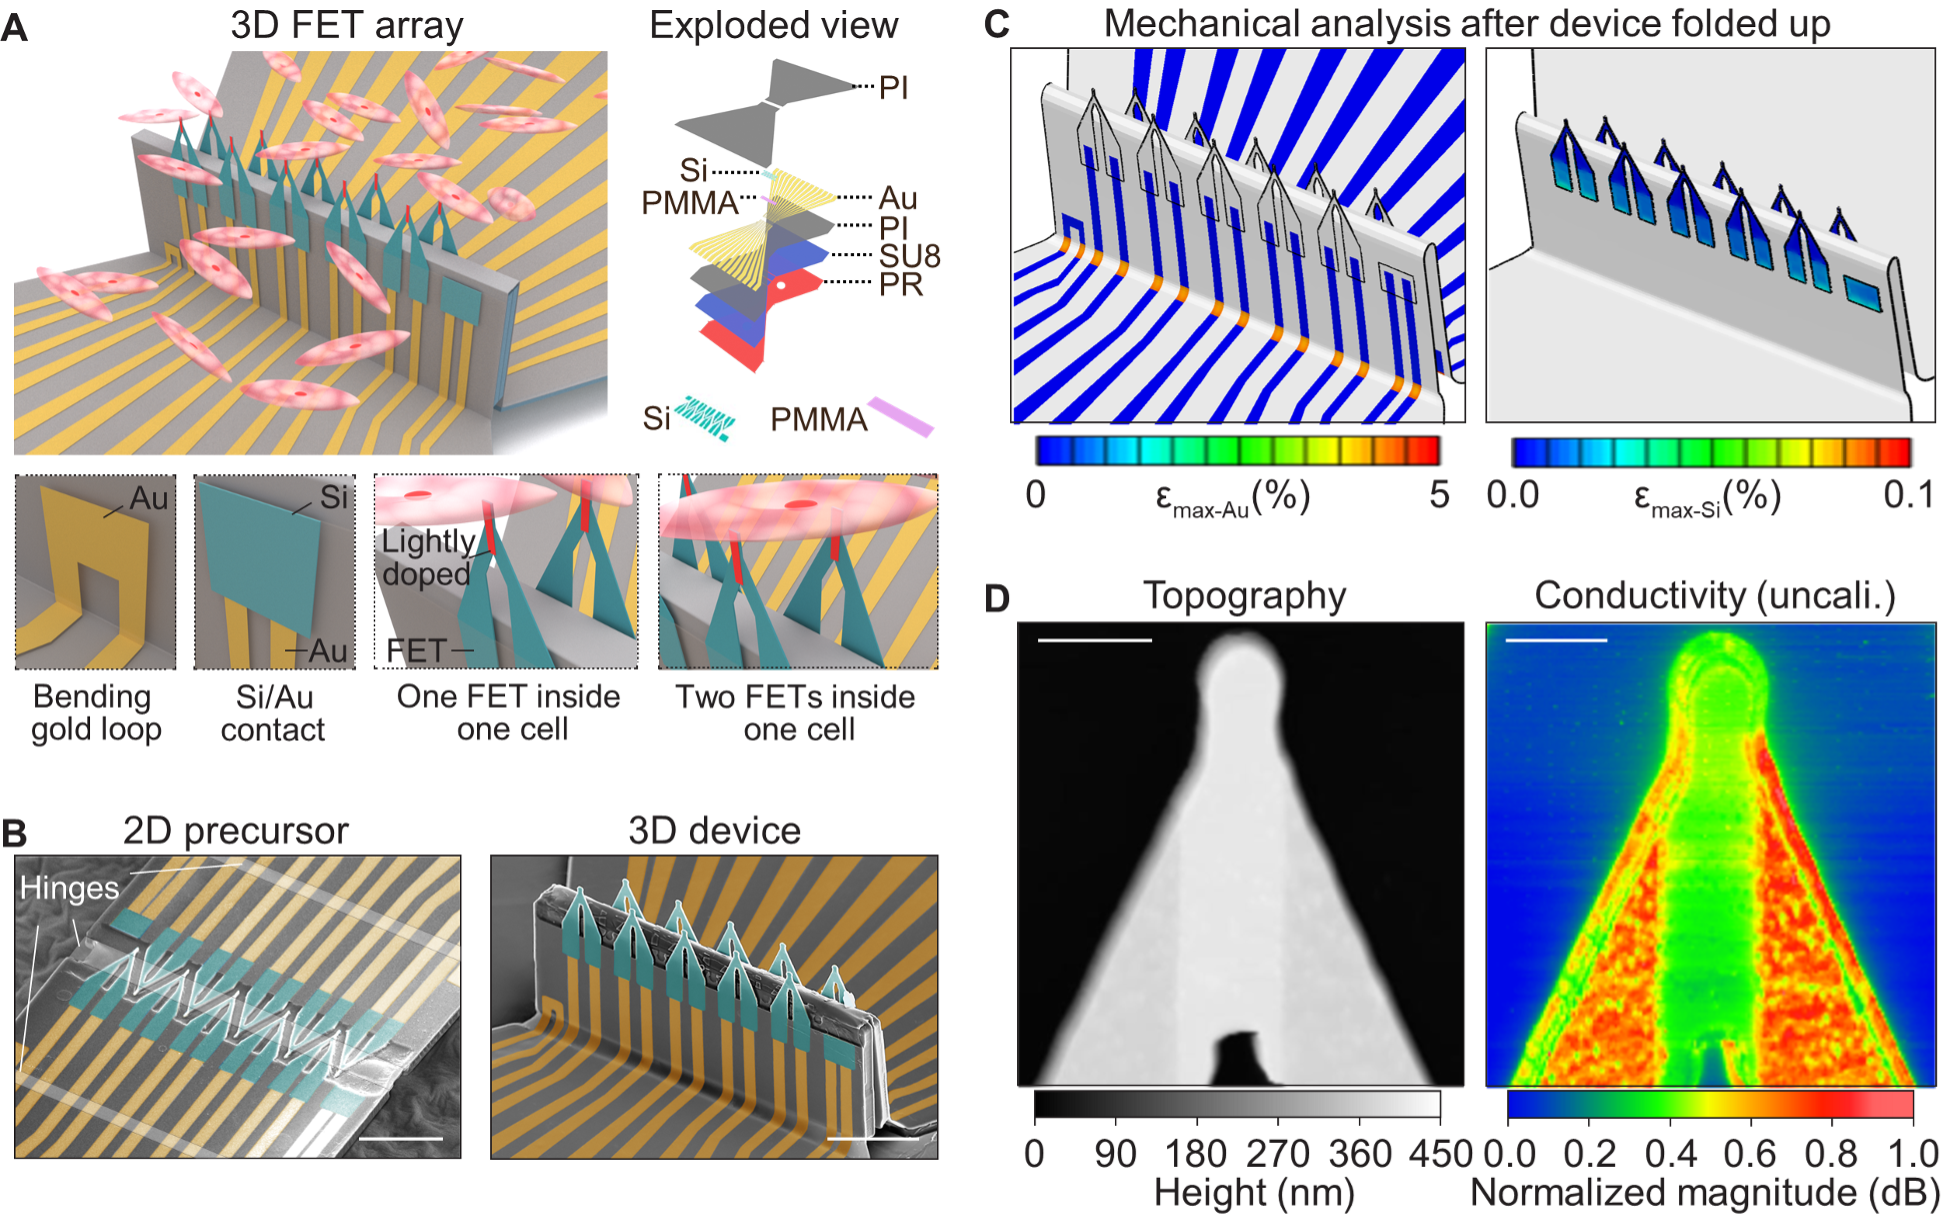
Fig. 1. 3D FET arrays by compressive buckling. (A) Schematic images showing a 10-FET array interfacing with a group of cardiomyocytes. An exploded view at the top right illustrates a multilayered design of the FET array. Inset images at the bottom showing, from left to right, an Au loop for checking the electrical conductivity after the device buckles, an Au/Si bilayer for probing the quality of electrical contact after the device is soaked in an acidic solution, one FET recording intracellular signals, and two FETs in the same cell to study intracellular signal conductions. The red area on each FET denotes the lightly doped channel. (B) False-colored SEM images showing the transformation from a 2D precursor (left) to a 3D 10-FET array (right). Each FET has a tapering tip (5 µm long and 1~2 µm wide). Scale bars: 50 μm. (C) Finite element analysis of a 3D 10-FET array. The maximum strains in Au and Si are well below the fracture limit of each material. (D) Images of an FET tip by atomic force microscopy (left) and a scanning microwave microscopy (right). The former operates in the contact mode and maps the surface topography of the FET. The latter maps the uncalibrated conductivity, and thus the admittance distribution, of the FET. A lightly doped region can be clearly distinguished in both images. Because of the over-etching of the oxide doping mask, the lightly doped region is slightly thicker than the surrounding heavily doped regions (Supplementary Note 1). Also, the lightly doped region shows a lower conductivity than the surrounding heavily doped regions (Methods, Supplementary Note 2, and fig. S5). Scale bars: 2 µm.
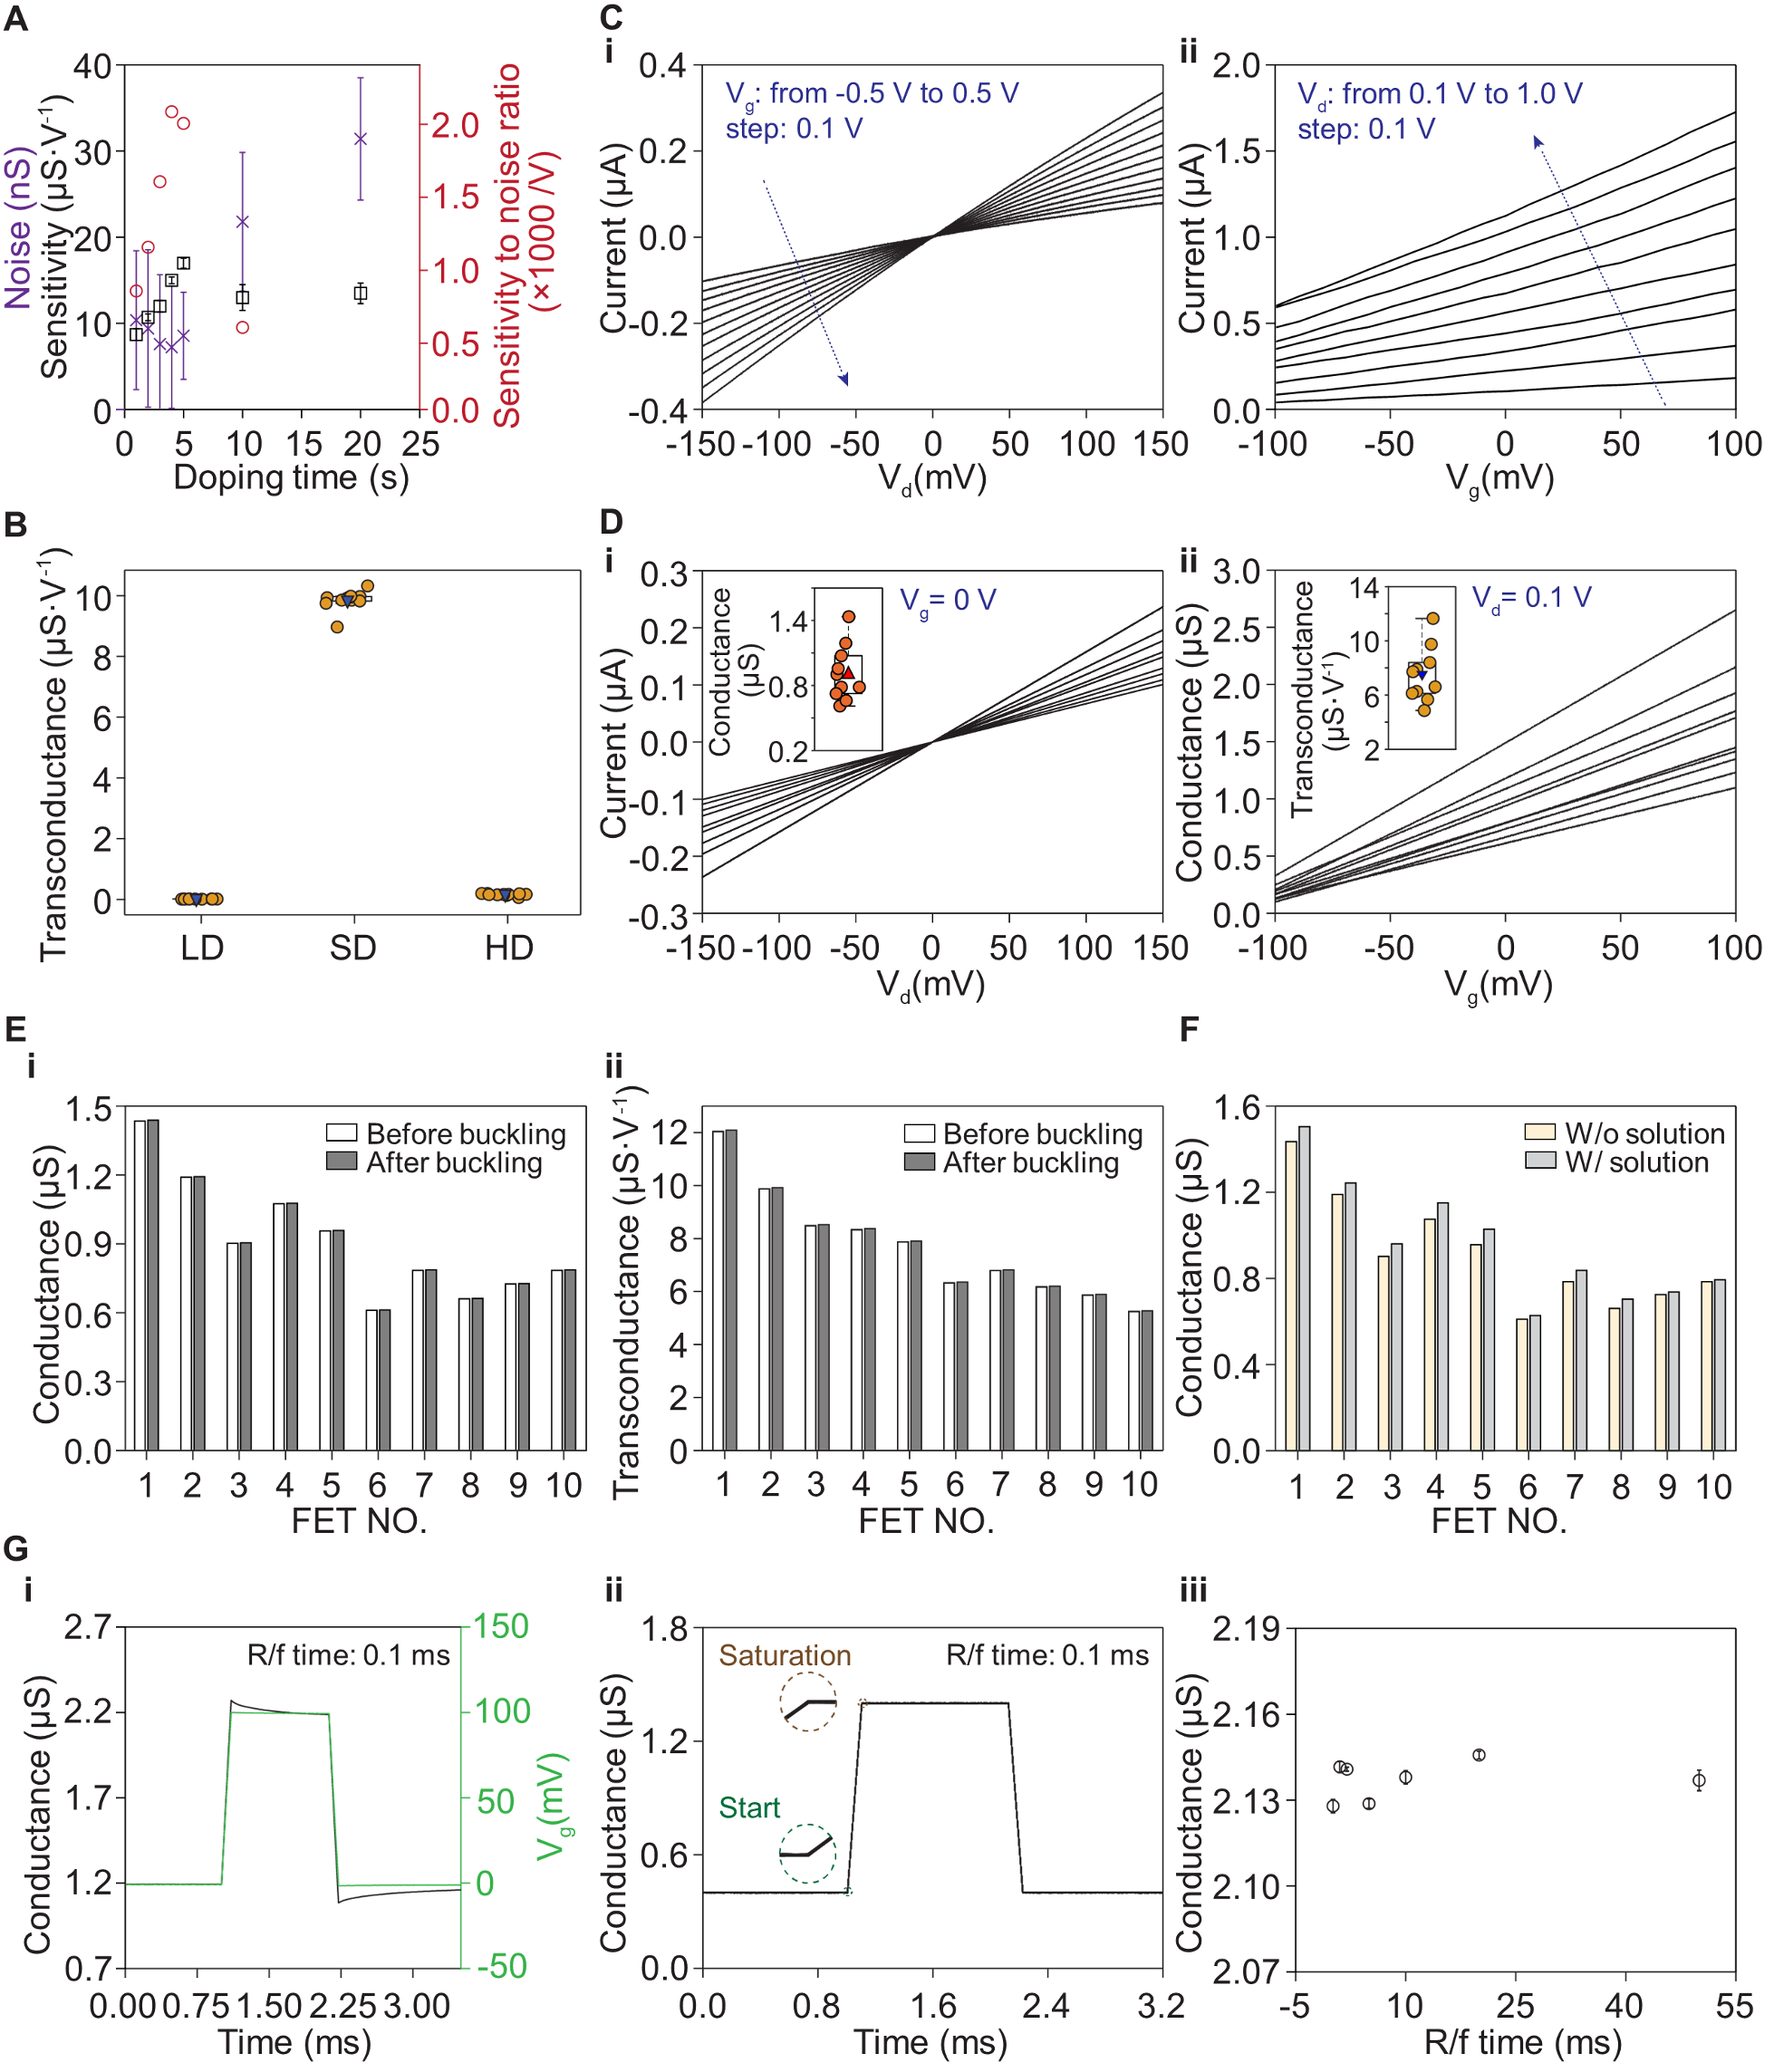
Fig. 2. Electrical optimizations and characterizations of the FETs. (A) The FET’s sensitivity-to-noise ratio as a function of the doping time in the lightly doped region. A doping time <4 s leads to a lower current in the conduction channel. A doping time >4 s results in higher noise, because of a larger number of traps generated by the doping-induced defects. (B) Calculated transconductances of three devices with different doping profiles (fig. S6), showing the FET structure is crucial for the high sensitivity: low doping (LD, uniform doping at ~107 Ohm·sq-1 from the silicon-on-insulator substrate), selective doping (SD, light doping at ~104 Ohm·sq-1 in the gate, and heavy doping in the drain and source), and heavy doping (HD, uniform doping at ~102 Ohm·sq-1). (C) (i) Output characteristics of the n-channel FET in the linear region under different applied gate voltages. (ii) Transfer characteristics of the FET under different drain voltages. The FET is in a depletion-mode, which is "ON" at zero gate voltage. It shows a high transconductance in the -100~100 mV regime. Vd: drain voltage; Vg: gate voltage. (D) (i) Output characteristics of each FET in a 10-FET array. Inset, distribution of the FETs’ conductance. (ii) Transfer characteristics of each FET in the array. Inset, distribution of the FETs’ transconductance. (E) Comparisons of the 10-FET array's (i) conductance and (ii) transconductance before and after compressive buckling, illustrating that the buckling process has no impact on the FETs’ electrical performance. (F) Comparison of the FETs' electrical conductance with and without a saline solution on the gate terminal, showing minimal current leakage of the FETs. The ionic solutions induce slightly more carriers (due to surface absorbed H+) and thus slightly higher conductance in the conduction channel. (G) Temporal response of the FETs to gate signals. (i) A 100 mV pulse (rising/falling (R/f) times: 0.1 ms; duration 1 ms, green curve) is applied to the gate. The corresponding conductance of the FET (black curve) exhibits changes coincident with the input signal without any noticeable delay. (ii) Repeated characterization of the same FET 10 times with an input gate signal at 100 kHz sampling rates (0.01 ms resolution). The FETs show no observable jitter (<0.01 ms) in the data acquisition system. (iii) The FET's conductance is reliable and independent from the rising/falling times of the input signals.
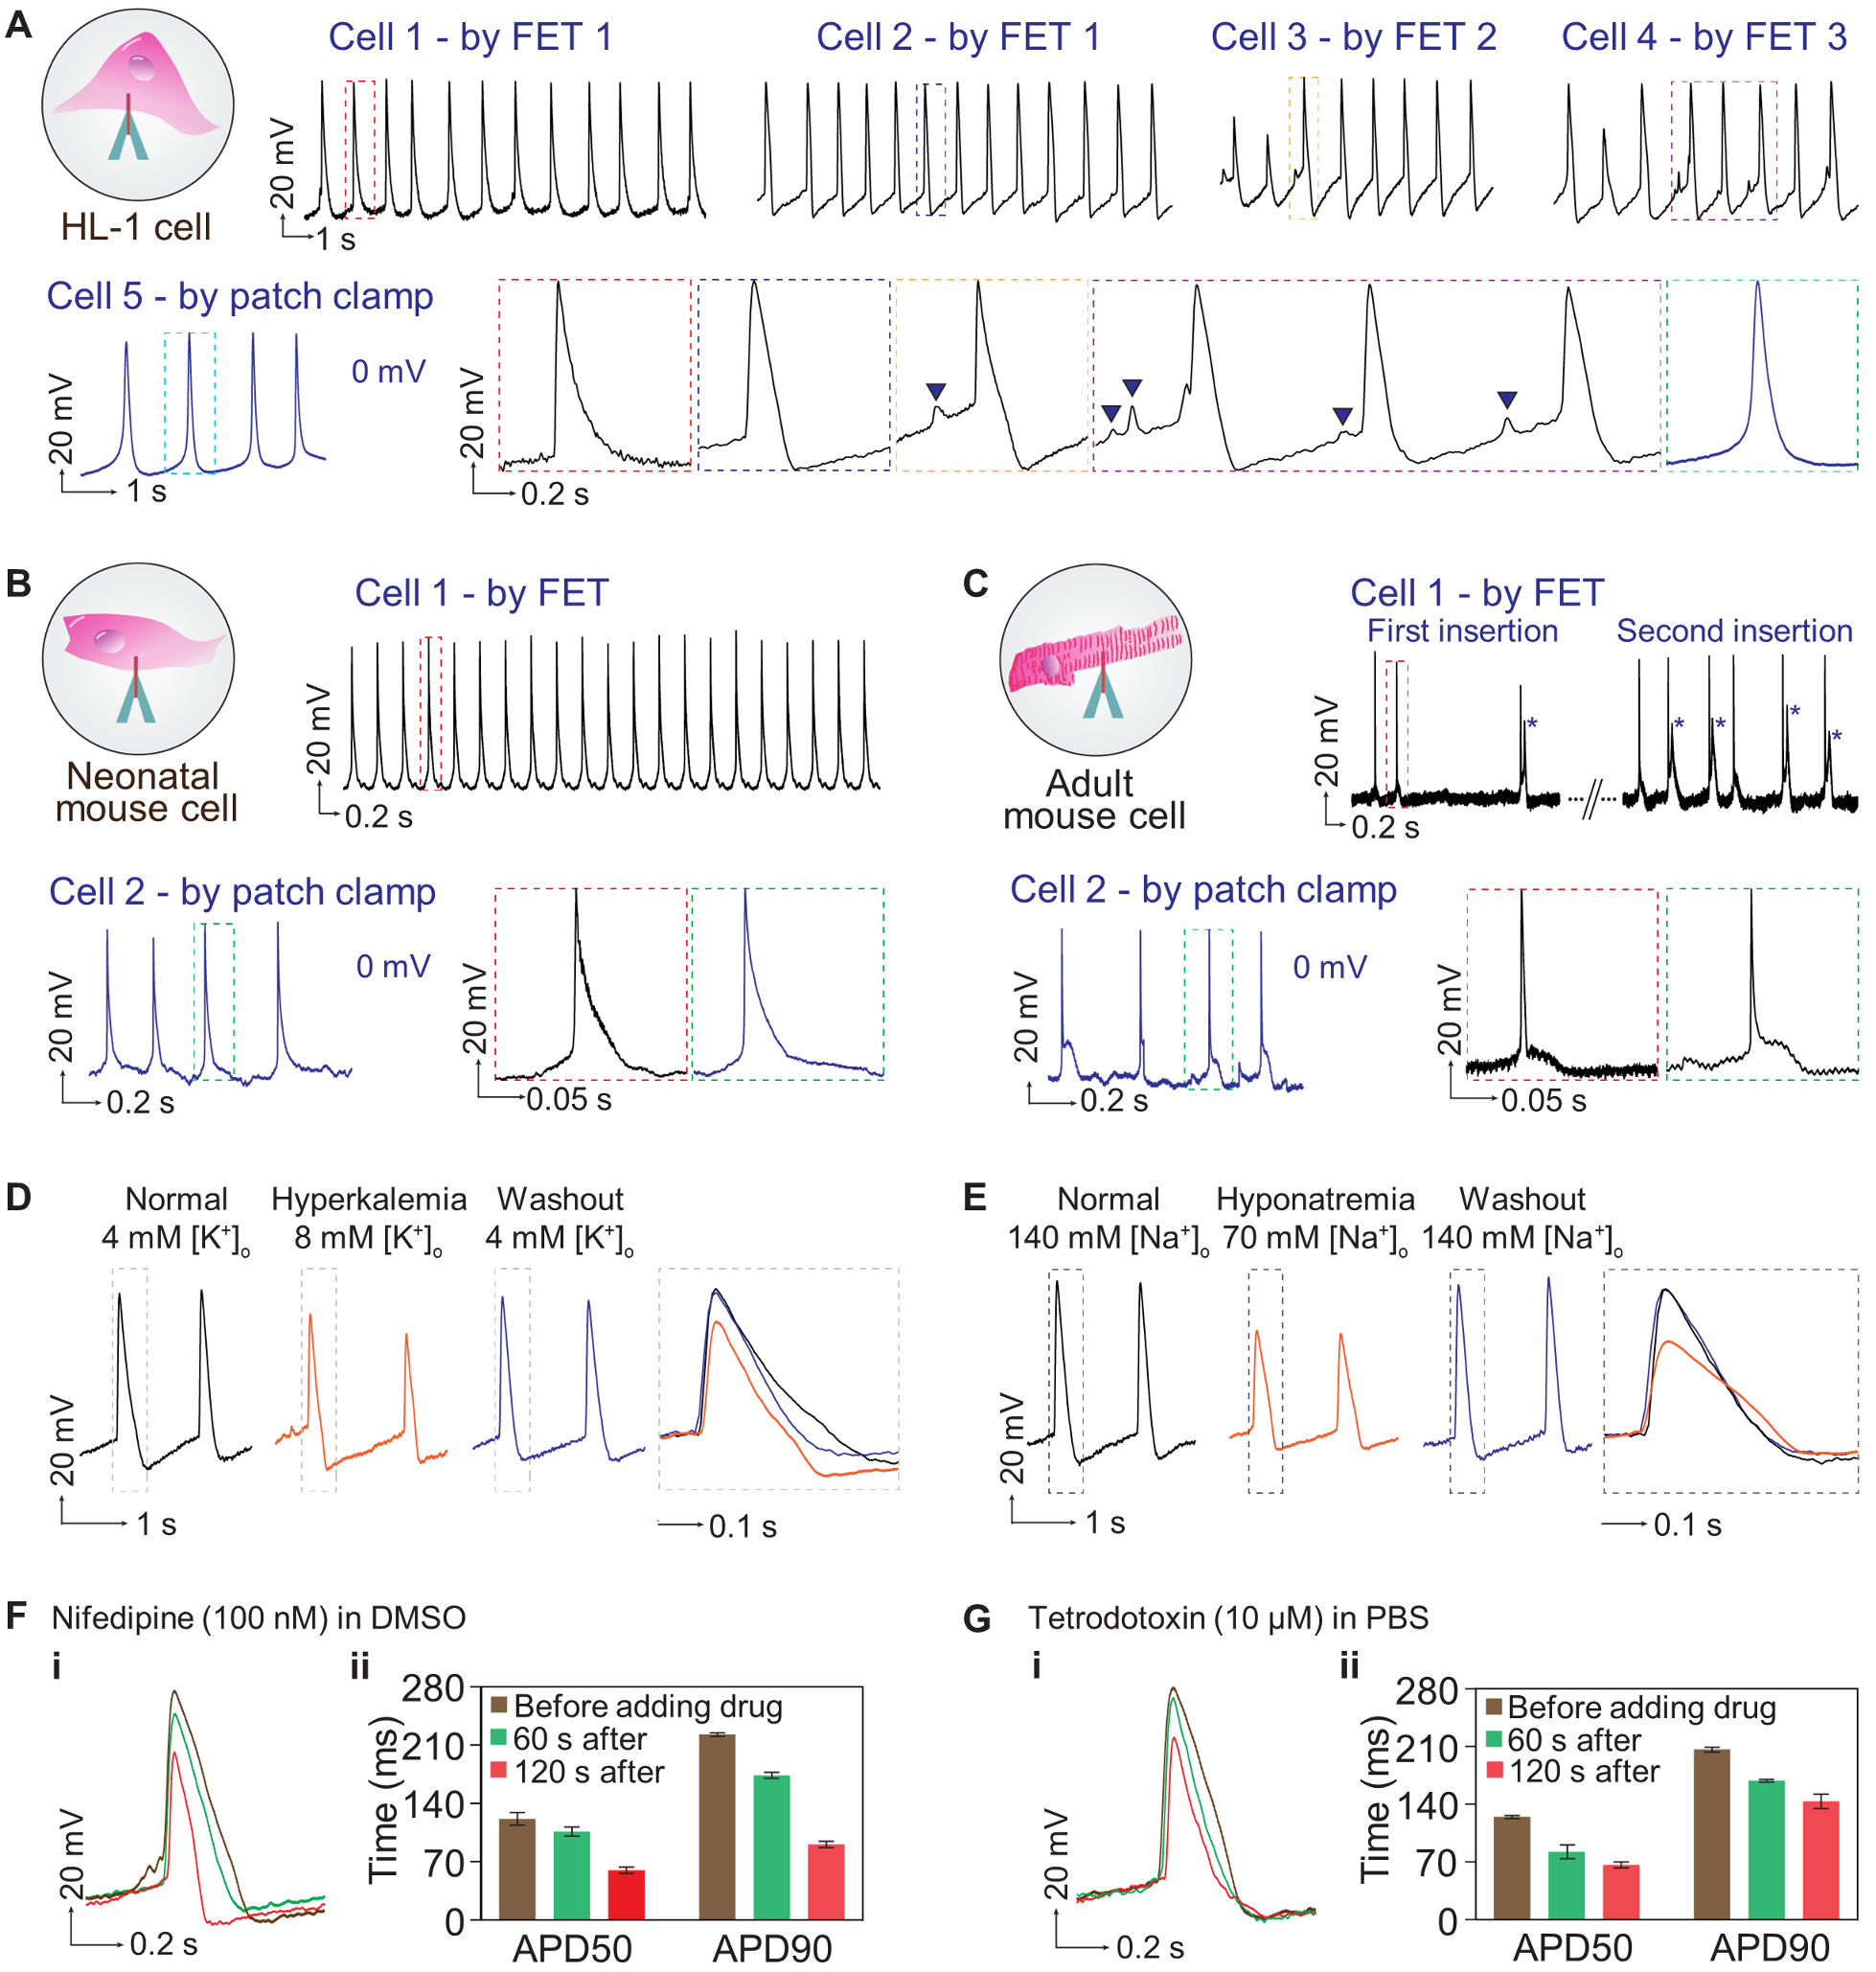
Fig. 3. Intracellular recordings and validations on single cardiomyocytes. (A) Periodic spikes can be recorded from different HL-1 cells by different FETs (top panels). The results are validated using the whole-cell patch (lower left panel). Enlarged regions of the recordings by the FET and the patch-clamp represent typical pacemaker action potentials of the HL-1 cells (lower right panels). The mean and standard deviation of the action potentials measured by the FET are 121.4 ± 1.3 mV, which are close to the 122.0 ± 4.0 mV measured by the patch-clamp, showing the FET's capability for recording full-amplitude action potentials. Sub-threshold signals (e.g., cell membrane oscillations of 5~15 mV) are captured in the recordings of cells 3 and 4, as highlighted by the black triangles. (B) and (C) Intracellular recordings from primary cells including (B) neonatal mouse atrial cardiomyocytes and (C) adult mouse ventricular cardiomyocytes. The relatively larger noise in (C) is induced by the contraction of the adult mouse cells during measurements. In some spikes in (C), an upstroke can be observed during repolarization, as marked by the asterisks, indicating abnormal Ca2+ influxes, which is also likely caused by the contraction. (D) and (E) Pathological studies of the HL-1 cells by modulating ionic concentrations in the culture solutions. Both (D) the hyperkalemia and (E) the hyponatremia cells exhibit a decreased signal amplitude, a shortened action potential duration (APD), and a longer refractory period compared to the normal cells, as recorded by the FET. The recorded action potentials recover when the culture solutions are switched back to the Tyrode's solution. (F) and (G) Effects of ion channel blocking drugs on (i) action potential morphologies of HL-1 cells recorded by the FET and (ii) corresponding quantitative analysis. Cells exposed to (F) 100 nM nifedipine exhibit a lower spike amplitude and shorter APD50 or APD90 (action potential duration at 50% or 90% repolarization, respectively). The cells repolarize very fast because nifedipine is an L-type Ca2+ channel blocker, which diminishes the influx of Ca2+ into the cells. (G) 10 μM tetrodotoxin acts on the rapid Na+ channels, reducing the spike amplitude and thus shortening the repolarization duration. Error bars are standard deviations of 20 recorded action potentials.
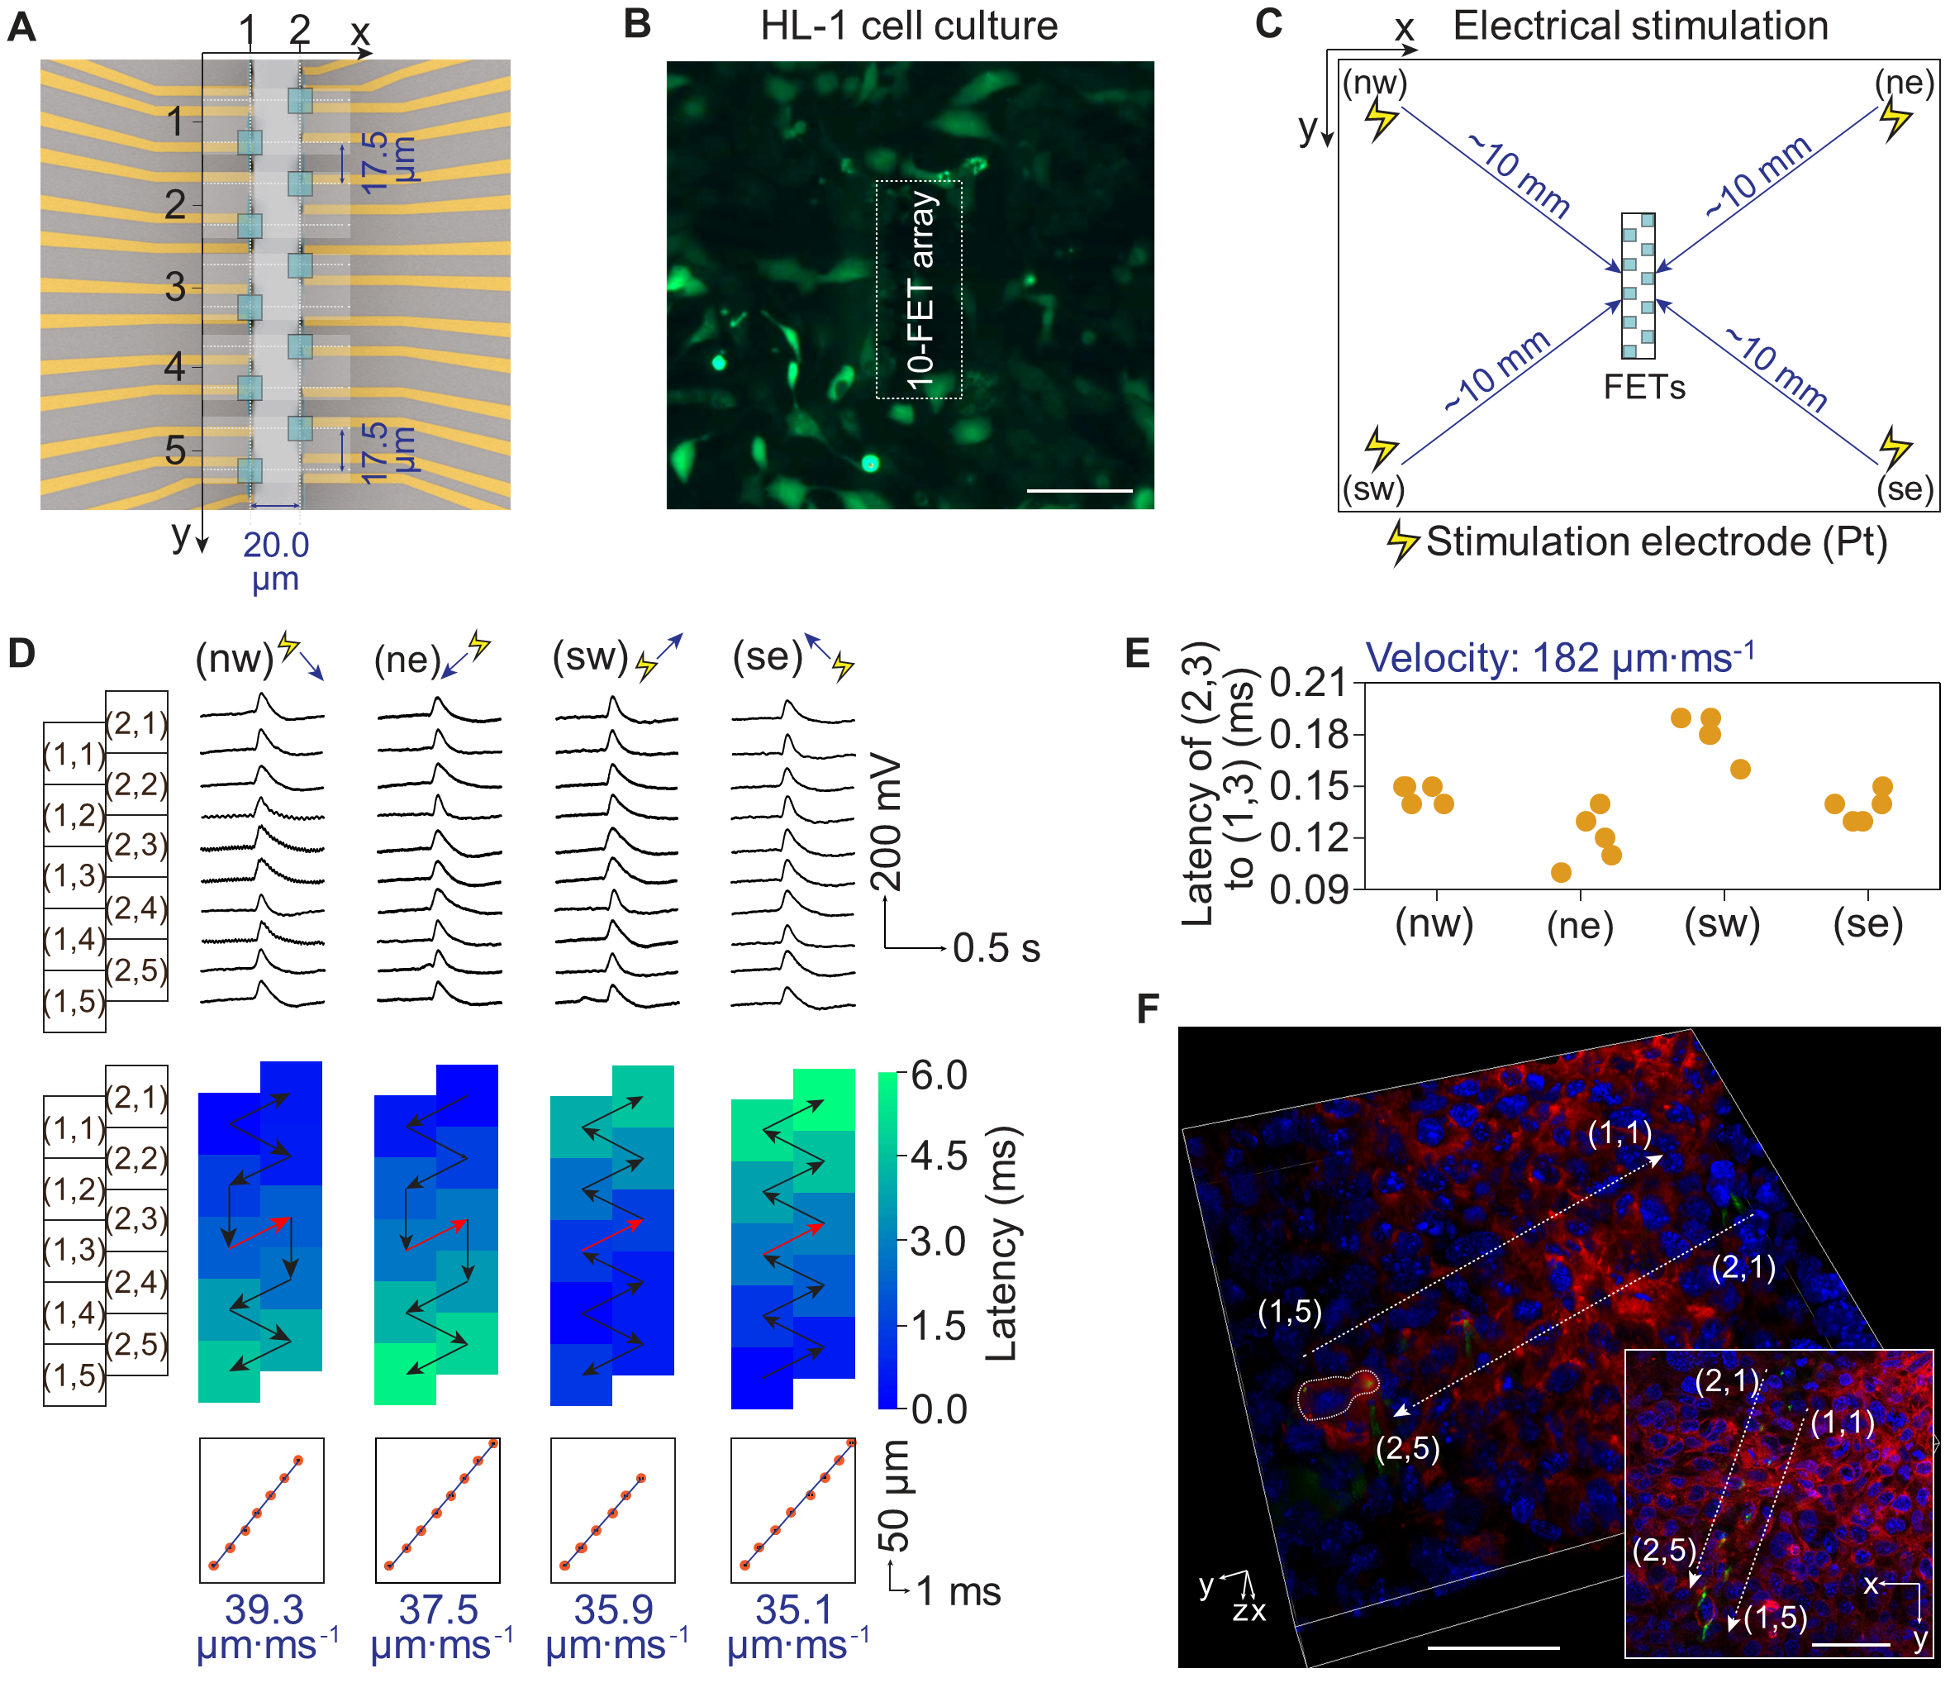
Fig. 4. Intracellular recording on a 2D HL-1 cell culture by a 10-FET array. (A) Schematic top views of a 10-FET array. The spacing between each FET is accurately defined by lithography. A coordinate system is used to denote the position of each FET, as indicated by the green squares. (B) A fluorescent image of a 10-FET array interfacing with a 2D culture of HL-1 cells (average size ~50 μm), stained by Fluo-4 am dye. Scale bar: 100 μm. (C) The schematic setup for stimulating the HL-1 cells, with four Pt electrodes placed in the cell culture on each corner. A stimulation pulse was applied to a single electrode in each measurement. We used biphasic pulses, so the net injection current was zero. The frequency, width, and amplitude of the pulses were 1 Hz, 1 ms, and 1 V, respectively, to effectively pace the cells. (D) Simultaneous intracellular recordings from a 2D HL-1 cell culture under electrical pacing at different orientations to the FETs. All FETs recorded periodic intracellular action potentials of 95~116 mV (fig. S28). Heat maps illustrate the latency of action potentials among the cells. Arrows indicate the possible signal conduction paths among cells, where the black arrows mean intercellular and the red arrows mean intracellular signal conductions. In all measurements, the signal first arrives at the cell closest to the stimulation electrode and then transmits subsequentially to the neighboring cells. The average intercellular conduction velocity is 35.1~39.3 μm·ms-1. Regardless of the stimulation orientation to the FETs, the intracellular signal conduction is always from (1,3) to (2,3). (E) The average and standard deviation of the latencies between (1,3) and (2,3) calculated from the 20 action potentials in four orientations being 0.146 ± 0.025 ms. The intracellular conduction velocity is 182 μm·ms-1, which is about five times the velocity of intercellular conduction. (F) Confocal microscopy images illustrating a 3D view of FETs intracellularly interfacing live HL-1 cells. Inset is the corresponding top view. Green (Rhodamine 6G): the polyimide in the FETs; Red (CellBrite): cell membranes; Blue (NucBlue): cell nuclei. The images clearly show two FETs, (1,5) and (2,5), are interfacing the same cell, whose corresponding action potentials recordings are in fig. S32D. Scale bars: 50 μm.
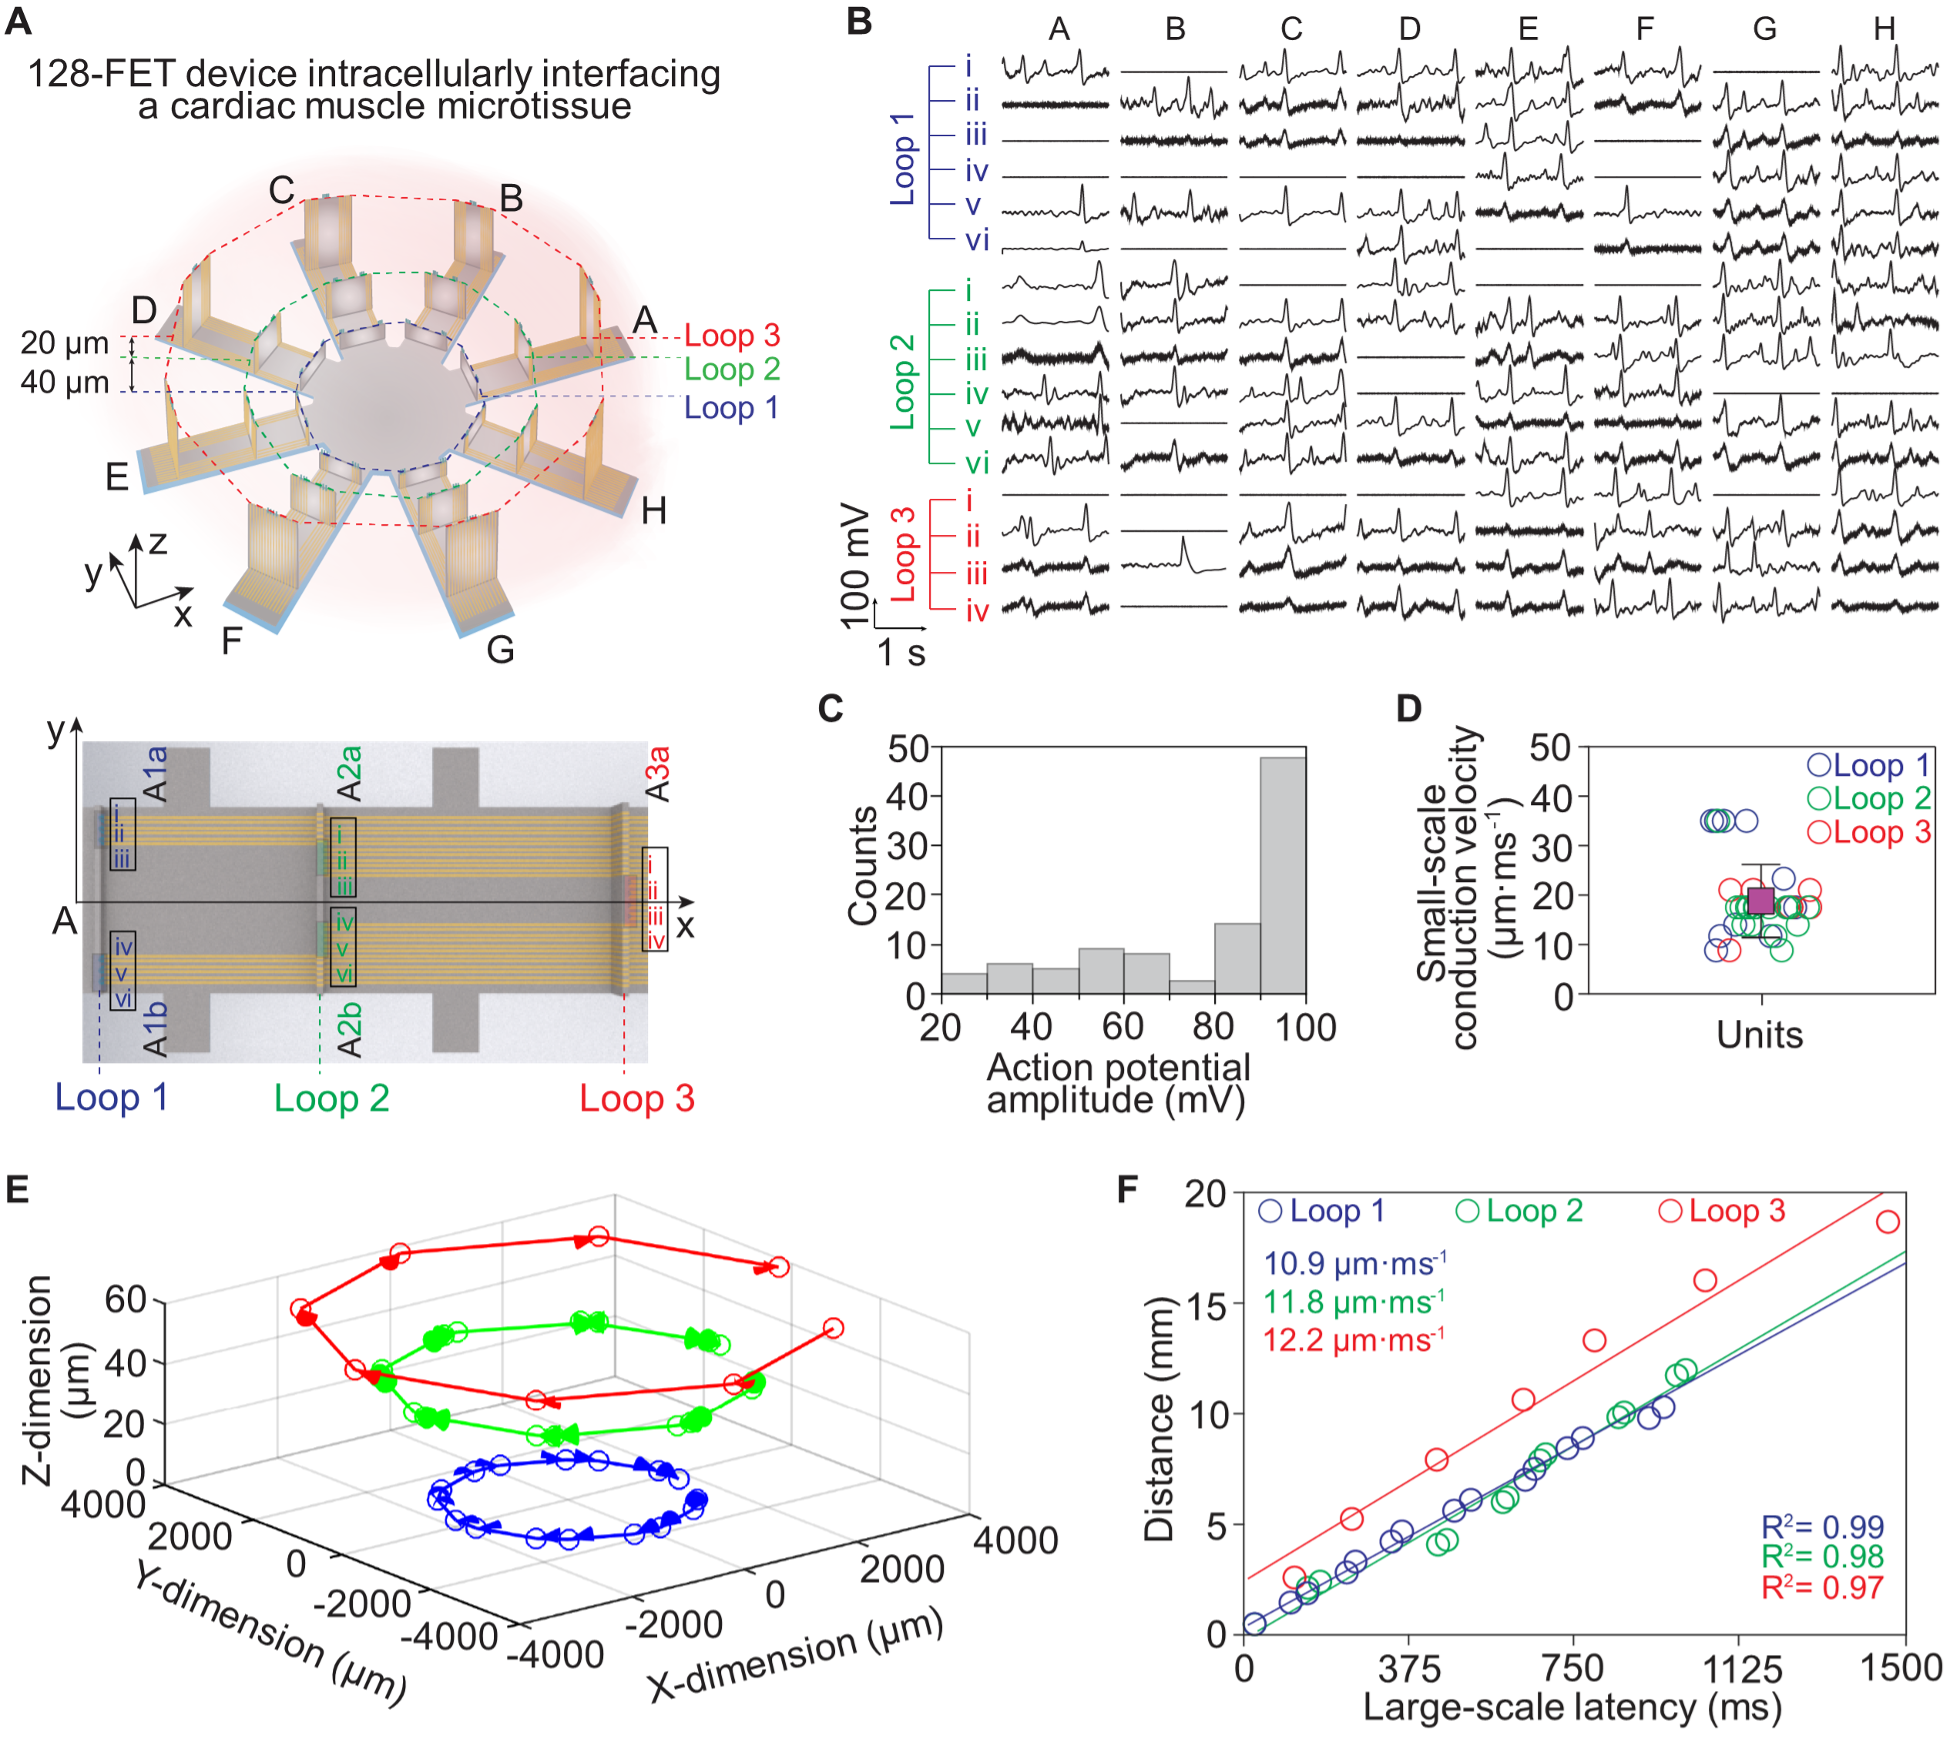
Fig. 5. Intracellular recording on a microtissue of neonatal rat cardiomyocytes by a 128-FET array. (A) Schematic diagrams of the 128-FET array distributed on eight arms. On each arm, there are 16 FETs in five units of different heights, distributed on three concentric loops (top panel). The 16 FETs’ relative positions and assigned coordinates are labeled (bottom panel). (B) Representative recordings from the 3D cardiac tissue by the 128-FET array. Intracellular action potentials are recorded from all three loops on each arm. (C) A histogram of spike amplitudes in (B). (D) The small-scale intercellular signal conduction velocity measured within each unit. The average and standard deviation of the velocities within the 40 units are 18.8 ± 7.5 µm·ms-1. (E) 3D visualization of the signal conduction in the whole 3D tissue construct. On all three loops, the signal conduction directions are consistent, beginning at arm H and then propagating to arm A. (F) Linear fit of the intercellular signal conduction velocity across the units in each loop.
Related reading:https://orcid.org/0000-0001-7114-1095
https://doi.org/10.1038/ s41565-021-01040-w
https://www.nature.com/articles/s41467-021-25075-8
https://www.nature.com/articles/s41467-021-24961-5
https://www.nature.com/articles/s41467-021-21436-5
https://www.nature.com/articles/s41578-020-00247-y
https://www.nature.com/articles/s41467-019-12462-5
https://bioengineeringcommunity.nature.com/posts/tackling-covid-19-with-materials-science https://bioengineeringcommunity.nature.com/posts/micropatterned-microfluidics-dendronized-fluorosurfactants-for-highly-stable-emulsions https://bioengineeringcommunity.nature.com/posts/nature-derived-2-dimensional-materials-for-cancer-therapy-and-sustainable-solutions https://bioengineeringcommunity.nature.com/posts/multi-targeted-reactive-oxygen-species-burst-for-cancer-therapy
https://bioengineeringcommunity.nature.com/posts/nat-nano-3d-fet-for-intra-inter-cellular-recording
Follow the Topic
-
Nature Nanotechnology

An interdisciplinary journal that publishes papers of the highest quality and significance in all areas of nanoscience and nanotechnology.


Please sign in or register for FREE
If you are a registered user on Research Communities by Springer Nature, please sign in