RUNX1 is a transcription factor that plays the role of “master regulator of hematopoiesis” through the antagonistic action of its three major protein isoforms, RUNX1A, B, and C. RUNX1A (the smallest between them) represents a minor fraction of the isoform pool (Figure 1). RUNX1A shows enhanced DNA binding, specific cofactors and divergent effects on target gene transcription as compared to RUNX1B/C. It enhances self-renewal activity and suppresses myeloid differentiation, and its overexpression can be leukemogenic as suggested by additional studies in other blood diseases. Given the pivotal role of the RUNX1 gene in acute myeloid leukemia (AML), we evaluated the expression of its isoforms in our series, aiming to elucidate the role of RUNX1A in the AML pathogenesis, its possible associations with different disease subtypes, and its influence during the disease course.

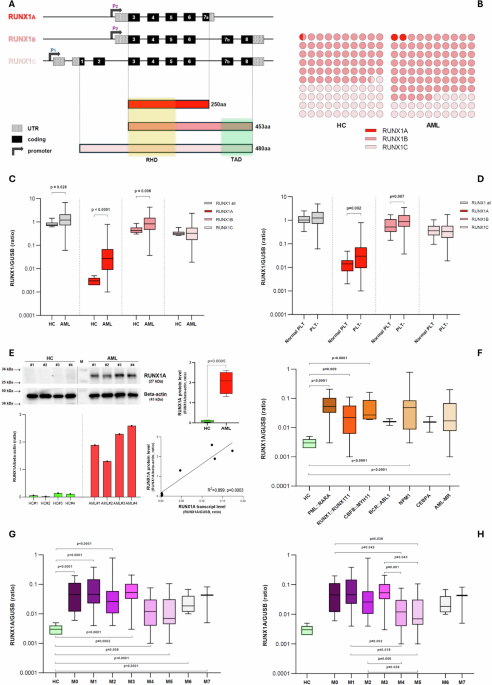
Figure 1. Schematic representation of RUNX1 three main transcript isoforms and their respective protein products. RUNX1A, interacting with specific cofactors, enhances self-renewal activity and suppresses myeloid differentiation. RUNX1 A, B and C relative quantification (as the fraction of total RUNX1 transcripts) in healthy controls is reported on top-left. P1: distal promoter; P2: proximal promoter; RHD: runt-homology domain; TAD: transactivation domain; HC: healthy controls.
Comparing AML cases at diagnosis (n=138) with HC (n=11), we observed the overexpression of RUNX1A [0.027 vs 0.003 RUNX1A/GUSB (R/G); p<0.0001] and RUNX1B (0.827 vs 0.433 R/G; p=0.006), whereas no difference was observed for RUNX1C (Figure 2A). Thrombocytopenic cases (n=93) showed higher levels of these two isoforms compared to AMLs with normal platelets (PLTs) levels (n=23) (0.030 vs 0.014 R/G; p=0.002 and 0.876 vs 0.517 R/G; p=0.007 respectively) confirming the previously established involvement of the RUNX1 gene in megakaryocytopoiesis (Figure 2B). Given the known leukemogenic role of RUNX1A and its more pronounced overexpression compared to the other RUNX1 isoforms (⁓10-fold increase between AML and HC median levels), we decided to focus on RUNX1A expression and its possible association with AML pathogenesis.

Figure 2. (A) Comparison of RUNX1 expression between healthy controls and AML cases at diagnosis (single isoforms and their sum are reported). (B) RUNX1 expression according to patient PLTs number. (C) Representatives immunoblot image of RUNX1A and beta-actin (top-left). Densitometric analysis of RUNX1A bands, expressed as relative optical density and normalized to beta-actin (bottom–left). Comparison between HC and AML RUNX1A protein levels (top–right). Simple linear regression between the RUNX1A transcript and protein levels (bottom-right). (D) RUNX1A transcript levels according to the FAB classes. (E) RUNX1A transcript level in AML cases subdivided by FLT3 mutational status; (F) a detailed analysis of FLT3-ITD patients is reported. Short ITD: duplication length ≤ 50bps, long ITD: duplication length > 50bps. (G) RUNX1A kinetics from diagnosis to CR. (H) Comparison of RUNX1 expression between healthy controls and AML cases at disease relapse (single isoforms and their sum are reported). (I) RUNX1A kinetics from diagnosis to disease relapse, for four cases that were FLT3-ITD negative at disease onset but FLT3-ITD mutated at relapse. (A,B,D,E,F,H) Boxplots representing the distribution. The boxes extend from the 25th to 75th percentiles. The line in the box represents the median value. The whiskers range from the smallest value to the largest. HC: healthy controls; AML: acute myeloid leukemia; PLT-: thrombocytopenic cases (<150.000 PLTs/ul); CR: complete remission.
Firstly, we verified the RUNX1A overexpression at the protein level by immunoblot analysis (Figure 2C). Increased RUNX1A protein levels were observed in AML patients compared to HC (2.018 vs 0.082 RUNX1A/B-actin, p=0.0005), and a positive correlation was found between the RUNX1A transcript and protein levels (rs=0.805, p=0.025) (Figure 2C).
RUNX1A levels were higher in AML patients with a more immature phenotype and characterized by impaired granulocytic differentiation (M0-M3) as compared to cases showing a monocytic morphology (M4-M5), in line with the known RUNX1A ability to suppress myeloid differentiation, enhancing the self-renewal capacity of hematopoietic stem cells (HSCs) (Figure 2D). In this context, M6 and M7 classes appeared to follow other pathways, which we cannot address given the rarity of cases among those enrolled.
According to the mutational profile, FLT3-ITD positive cases presented the highest RUNX1A levels (0.071 R/G), and the presence of FLT3-ITD was the only molecular variable able to influence the RUNX1A expression (p=0.0005). FLT3-ITD AMLs (n=23) showed higher RUNX1A levels than FLT3-wt cases (n=82) (0.071 vs 0.020 R/G, p<0.0001), on the contrary FLT3-TKD patients (n=10) showed lower RUNX1A levels than FLT3-wt ones (0.006 vs 0.020 R/G, p=0.025). RUNX1A overexpression was higher in long ITD cases (>50bp, n=11; characterized by more FLT3 auto-phosphorylation and poorer survival outcomes) when compared with short ITD ones (n=8) (0.131 vs 0.037 R/G, p=0.02) (Figure 2E-F).
With the aim of studying RUNX1A kinetic expression during the disease course, we evaluated the levels at the complete remission (CR) stage and at disease relapse (DR). When patients achieved CR, their RUNX1A levels reverted to normal values (Figure 2G). At the DR, the RUNX1A overexpression reappears without a clear kinetics except from cases FLT3-ITD negative at diagnosis (n=4), but FLT3-ITD mutated at the DR who exhibited an increased RUNX1A expression (p=0.033) (Figure 2H-I).
The RUNX1 cooperation with FLT3-ITD in leukemia induction is already known: FLT3-ITD AML patients express high levels of RUNX1. Notably, no studies have specifically focused on the expression of the three RUNX1 isoforms. However, it has been demonstrated that the RUNX1 upregulation in FLT3-ITD positive AML may partially result from the presence of an ITD-specific open region of chromatin (a DNase I hypersensitive site - DHS) within the RUNX1 gene, approximately 10kb upstream of exon 6, whose alternative splicing generates the RUNX1A isoform. Although we cannot verify this direct connection, it is conceivable that in FLT3-ITD AML, this open region at the 5’ end of exon 6 may facilitate regulator access, promoting alternative splicing in favor of RUNX1A production, as recently described (Figure 3).

Figure 3. Illustration of a possible molecular connection between FLT3-ITD and RUNX1A overexpression, based on recent literature data.
To verify whether RUNX1A upregulation is linked to a specific transcriptional profile, high-throughput RNA sequencing was conducted. A total of 756 protein-coding genes (557 up and 199 down) and 1,159 elements belonging to other categories (lncRNAs, miRNAs, pseudogenes, etc.) were differentially expressed between cases with “high” and “normal/low” RUNX1A levels.
“Neutrophil degranulation” (p=5.85E-20) was identified as the TOP canonical pathway deregulated, with 56 DEGs; the majority of them being downregulated genes. The activation state of the pathway was identified as “decreased” (z-score = -6,682) (Figure 4A). Interestingly, this observation is in line with the known RUNX1A ability to suppress myeloid differentiation and with the higher RUNX1A levels observed in our AML cases with a more immature phenotype and characterized by impaired granulocytic differentiation (M0-M3). Notably, when focusing on the TOP five DEGs (upregulated and downregulated) between the two groups (Figure 4B), the POU4F1 (Log2FC=6.72, padj=0.009) and SFRP1 (Log2FC=-5.33, padj=0.005) genes stand out. In fact, POU4F1 overexpression has already been associated with RUNX1::RUNX1T1 AML and is known to contribute directly to its unique transcriptional signature; on the contrary, SFRP1 is a transcriptional repression target of the RUNX1::RUNX1T1 fusion protein in AML.

Figure 4. (A) Top ten deregulated canonical pathways identified from IPA analysis. (B) Volcano plot visualizing differentially expressed protein-coding genes (with p-value <0.05) between the two groups of patients (high and normal/low RUNX1A expression). Upregulated (Log2FC > 1.5) and downregulated (Log2FC < -1.5) genes are marked in red and green, respectively. The top five deregulated protein-coding genes are reported in the table (top–right).
The AML biological heterogeneity underscores the need for deeper insights into the molecular mechanisms underlying disease development. Our data aims to contribute a new piece to the jigsaw of the AML molecular pathogenesis, in which RUNX1 involvement is established. Our effort to shed light on the dark side of RUNX1 dysregulation may also offer the opportunity to look on RUNX1A as a new AML therapeutic target. In fact, restoring the RUNX1 isoforms equilibrium could reverse the oncogenic potential of isoform A, as recently shown in Down Syndrome – associated myeloid leukemia (ML-DS). In the meantime, another piece has been added to the complex scenario of the AML pathogenesis.
Follow the Topic
-
Cancer Gene Therapy
The essential gene and cellular therapy resource for cancer researchers and clinicians, keeping readers up to date with the latest developments in gene and cellular therapies for cancer.


Please sign in or register for FREE
If you are a registered user on Research Communities by Springer Nature, please sign in