Seeing Hidden Microbial Signals Through Coverage: The Story Behind micov
Published in Ecology & Evolution, Microbiology, and Protocols & Methods
When we study metagenomes, we are looking at a vast, mixed puzzle of microbial genomes - billions of tiny fragments from bacteria, archaea, viruses, and more. From these fragments, we try to answer deceptively simple questions: Who’s there? What are they doing? And how do they differ between environments or hosts?
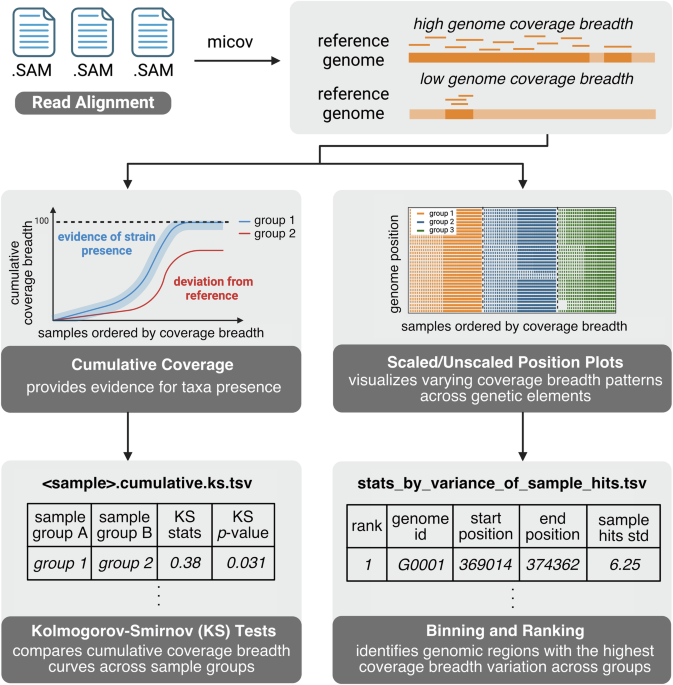
Many bioinformatics tools have focused on the first question, reporting which microbial taxa are present and at an estimated relative abundance. To answer this question, one under-utilized signal in metagenomics is the breadth of coverage: how much of a genome’s sequence is covered by at least one read. This measure can be used to inform whether a reference genome is detectable, while further providing distribution information of the breadth of coverage across samples.
Despite its importance, there hasn’t been a simple way to compare coverage breadth across many genomes, samples, and study covariates. This gap motivated us to create micov, short for MIcrobiome COVerage, a lightweight yet powerful tool designed to make coverage-based analysis fast, intuitive, and informative.
From single snapshots to cumulative views
In traditional coverage analyses, we often summarize a genome’s coverage breadth at the study level: for instance, “80% of this genome is covered in our study.” That works fine if you only care about removal of false positives from your study. However, this single aggregate statistic conceals rich patterns, such as which regions of a genome have coverages that vary between groups of samples, and whether a microbe’s signal accumulates differentially (for example, healthy versus disease groups).
Inspired by how astronomers stack multiple long-exposure photographs to reveal faint stars, we designed a scalable approach to aggregate coverage. In deep space images, individually, each image may contain too much noise or too little light to distinguish the object of interest - but when you combine the images, the true pattern emerges.
This idea led to micov’s cumulative coverage plots. Instead of collapsing coverage into one number per sample or per study, we line up samples by their total individual coverage breadth and then cumulatively merge the exact covered regions to report the “cumulative” observed breadth of coverage. If a genome is genuinely present across samples within a group, its signal builds smoothly across the genome. If the apparent signal is due to contamination or random noise, the cumulative pattern plateaus. These cumulative curves can then be tested for whether they are statistically different through standard Kolmogorov-Smirnov tests.
This simple visualization transformed how we interpret faint microbial signals, particularly in low-biomass environments like tissue or wastewater, where the difference between “present” and “absent” can hinge on a handful of reads.
Building micov: fast, flexible, and metadata-aware
Technically, micov sits downstream of any read-mapping workflow that produces SAM or BAM files. It computes the per-sample coverage breadth for each genome, indexes this data for fast look-up, and then performs group-specific cumulative and positional analyses.
Two features make micov different from existing tools:
Differential cumulative breadth by sample type.
Instead of reporting one genome-wide statistic across all samples, micov calculates cumulative coverage curves for user-defined categories such as disease states, diet groups, sampling sites, or any categorical study variable. This enables rigorous group-level comparisons without requiring artificial subsampling or threshold tuning.
Differential coverage regions along genomes.
micov divides genomes into bins and identifies regions with varying coverage across groups. This highlights strain-level variation and mobile elements that distinguish subpopulations.
In addition to adding functionalities that are novel to existing tools, we designed micov to be as fast as the best existing mappers, on par with CoverM1.
Putting micov to the test
We applied micov to three metagenomic contexts to evaluate the utility of per sample and differential breadth of coverage:
1. Human gut microbiomes from the THDMI study.
Using over 1,200 fecal samples from the US, UK, and Mexico, we explored strain variation within Prevotella copri, a common human gut microbe with known strain variations2. micov pinpointed a short region, spanning only a few kilobases representing genes with extracellular associated annotations. The presence and absence of this region, in samples in which Prevotella Copri was detected, explained more variation in overall microbiome composition than the participants’ country of origin. The signal was supported by paired 16S rRNA amplicon samples, despite the detected region lacking ribosomal genes. The discovery showed that a single genomic segment can have a community-wide impact, a signal that would remain hidden in conventional metagenomic analyses.
2. Diet-associated genes in an uncharacterized Lachnospiraceae genome.
When comparing people consuming more than 30 types of plants per week versus fewer than ten, micov identified a region whose coverage increased with dietary diversity. Most genes in the detected region lacked known annotations. Since micov analyzes coverage independent of genome annotation, it can uncover previously unrecognized diet-associated genes and highlight candidate regions for future functional investigation.
3. Low-biomass detection in wastewater and tissue.
We used micov to detect a single genomic copy of enteropathogenic Escherichia coli spiked into wastewater samples with cumulative coverage. Critically, the background wastewater contains Escherichia coli, yet despite this, the presence of a single genome copy was sufficient for a significant difference against background. Separately, cumulative coverage distinguished Mediterraneibacter gnavus in mucosal versus adipose tissues from Crohn’s disease patients. In both cases, micov’s cumulative curves revealed presence patterns that traditional abundance estimates could not confirm with confidence.
These examples demonstrate that micov is sensitive to the coverage variations in low-biomass samples and can lead to biologically meaningful observations: it detects fine-scale genomic variation linked to real ecological and clinical traits.
Why coverage matters
Breadth of coverage may sound like a dry statistic, but it captures something profound about microbial life - the completeness of a genome’s representation in an environment. Partial coverage can signal strain variation, mobile genetic elements, or incomplete colonization. Differential coverage patterns can reveal hidden ecological structure, regions that rise and fall across hosts, diets, or geographies.
By quantifying and comparing these patterns systematically, micov turns a well known but underutilized measure into a lens for understanding microbial heterogeneity. It complements high-resolution SNP-based tools like InStrain or MIDAS by focusing not on individual mutations, but on broader genomic segments that vary between populations.
From frustration to foundation
Like many tools, micov was born from practical frustration. We repeatedly faced datasets where certain microbes appeared in some samples but not others, and we needed to know whether these differences were real or artifacts of sequencing depth.
We realized that a general, efficient solution could serve the entire metagenomics community, one that handles both exploratory visualization and formal statistics in a single framework. micov grew out of that need, shaped by countless discussions between computational and wet-lab researchers trying to make sense of noisy signals from complex samples.
Looking ahead
We see micov as a bridge between raw sequencing data and biological interpretation. Its strength lies not just in speed, but in how it reframes coverage as a dynamic, comparative signal rather than a static number.
micov is not dependent on a specific reference database. It is designed to interoperate with the automatically computed Bowtie2 alignment data from Qiita, simplifying enabling cross-study comparisons of differential coverage at scale. Next, we are exploring the application of micov in long read metagenomic samples as well as additional visualizations that could potentially elucidate links between coverage variation and gene function, transforming what began as technical optimization into a foundation for new biological hypotheses.
References
1. Aroney, S. T. et al. CoverM: read alignment statistics for metagenomics. Bioinformatics, 41(4), btaf147 (2025).
2. Blanco-Míguez, A. et al. Extension of the Segatella copri complex to 13 species with distinct large extrachromosomal elements and associations with host conditions. Cell Host Microbe. 31, 1804–1819.e9 (2023).
Follow the Topic
-
Communications Biology

An open access journal from Nature Portfolio publishing high-quality research, reviews and commentary in all areas of the biological sciences, representing significant advances and bringing new biological insight to a specialized area of research.
Related Collections
With Collections, you can get published faster and increase your visibility.
Signalling Pathways of Innate Immunity
Publishing Model: Hybrid
Deadline: Feb 28, 2026
Forces in Cell Biology
Publishing Model: Open Access
Deadline: Apr 30, 2026


Please sign in or register for FREE
If you are a registered user on Research Communities by Springer Nature, please sign in