What Caused the Shift in El Niño's Impact on Central Asia's Rainfall?
Published in Earth & Environment

Central Asia (CA) is one of the world's largest semi-arid to arid regions, including Kazakhstan, Uzbekistan, Turkmenistan, Kyrgyzstan, and Tajikistan. Known for its continental climate, CA has a fragile ecosystem, especially sensitive to changes in precipitation. The primary rainy season, particularly in southern CA, falls in spring, which coincides with the major growing season for agriculture1, 2. The variability in spring Central Asian precipitation, or SCAP, is a critical indicator for the region's water resources, ecosystems, and economic activities.
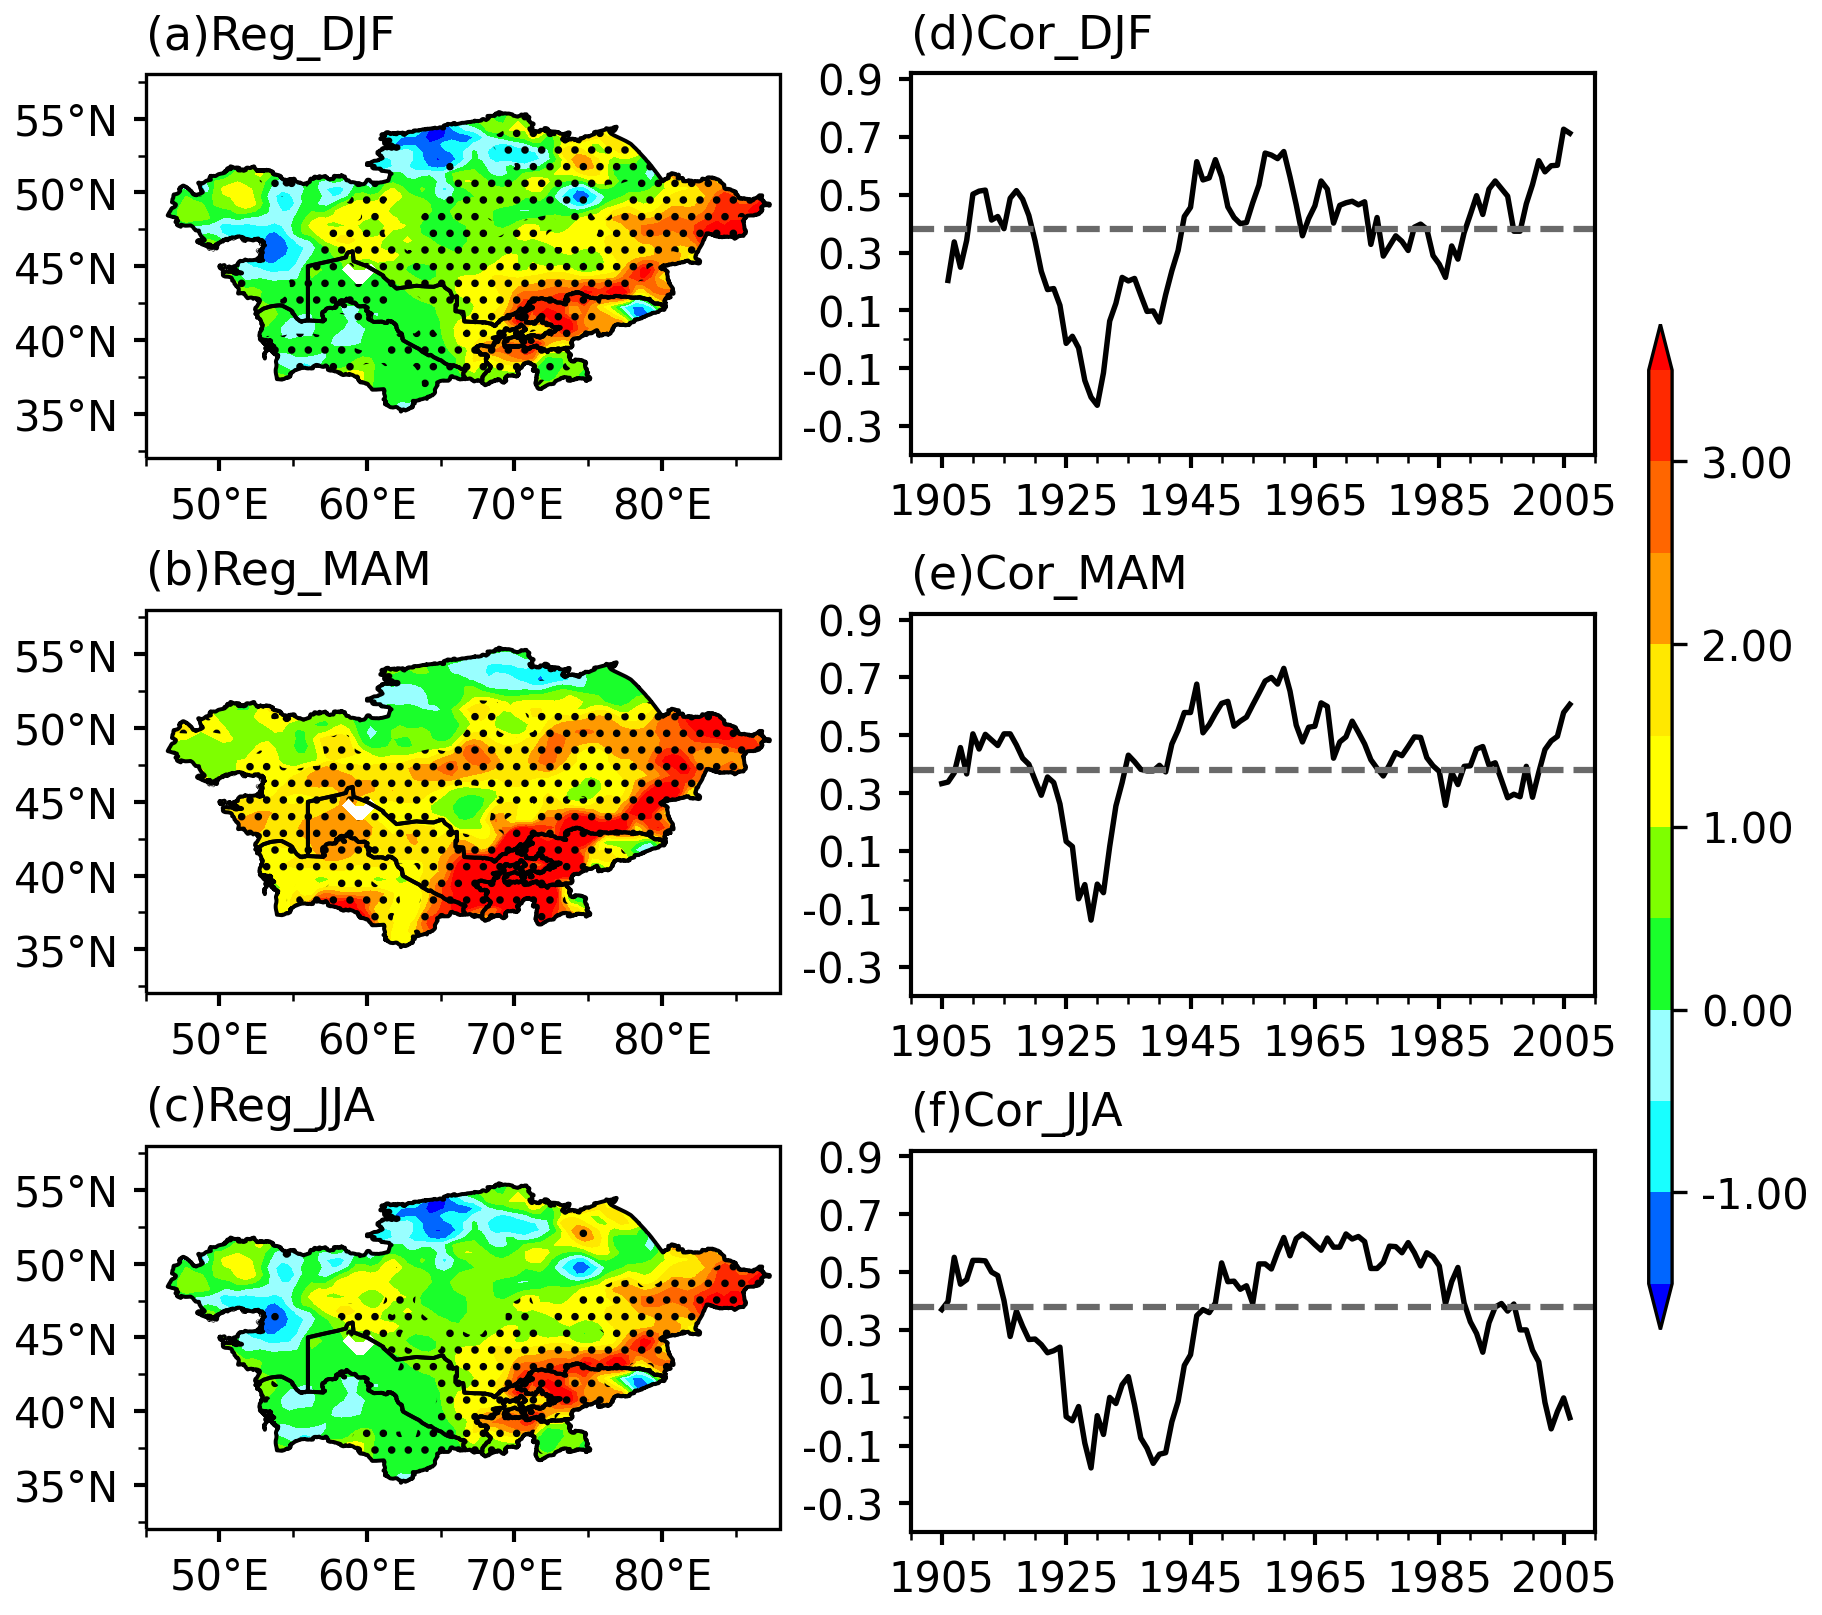
Researchers have long established that El Niño–Southern Oscillation (ENSO) significantly influences rainfall patterns in CA3. Typically, an El Niño event, occurring in the preceding winter, brings more rain to the region by enhancing moisture transport and intensifying updrafts4, 5. However, the relationship between ENSO and spring precipitation in CA has not been constant over time. Historical data show that this correlation weakened significantly in the 1930s, gradually strengthened until the 1960s, and has been on the rise again since the 2000s (Figure 1).

Figure. 1 Response of different seasonal precipitation to El Niño in observation. (a) Regression and (d)19-yr sliding correlation of the DJF(0) precipitation with the normalized DJF(0) Niño3.4 index in the observation for the period 1891–2020. (b, e) and (c, f) Same as (a, d), but for MAM(1) and JJA(1), respectively. The dots and dashed lines denote the 90% confidence level.
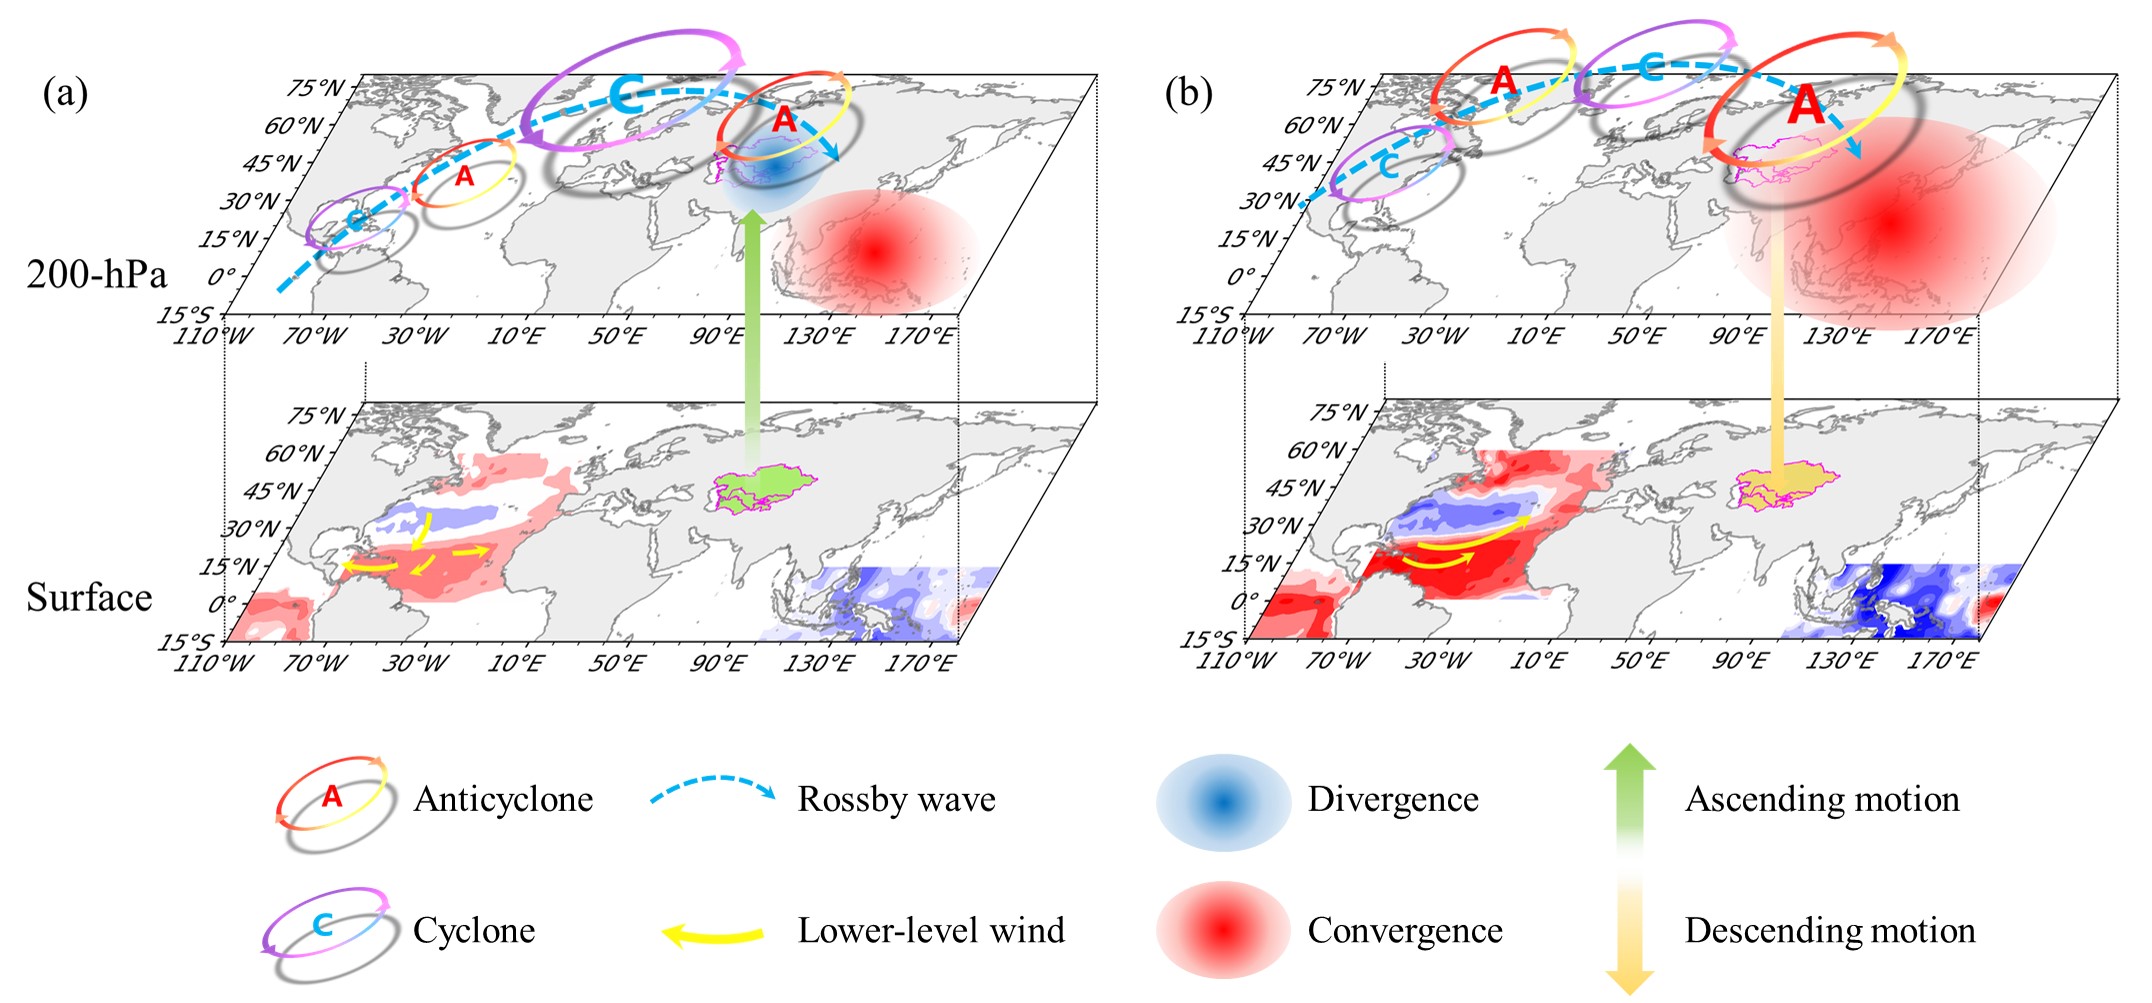
So, what caused these shifts? Our observations and climate model simulations suggest two key factors that may explain the interdecadal shifts in the ENSO–SCAP relationship. The first factor is related to changes in the meridional pathway—how Pacific sea surface temperature (SST) anomalies affect moisture and atmospheric dynamics over CA. During El Niño events, there is typically strong upper-level divergence over the central-eastern Pacific and convergence over the western Pacific. This pattern leads to upper-level divergence over CA, promoting vertical motion and increasing precipitation. During periods when the ENSO–SCAP relationship is strong, the upper-level divergence over CA is more pronounced, leading to more significant rainfall. In contrast, during periods when this relationship is weak, the effect is less marked.
The other factor involves the influence of North Atlantic (NA) SST anomalies. During the LC period, a specific SST anomaly pattern—characterized by cold anomalies in the middle NA and warm anomalies in the NA subpolar gyre and tropical NA—plays a role in disrupting the positive influence of El Niño on CA's spring rainfall. This disruption is more significant during periods of weak ENSO–SCAP correlation, contributing to the variability in the relationship.
But what drives these changes in NA SST? The answer appears to be linked to the wind patterns influenced by how quickly ENSO events decay. During periods of weak ENSO–SCAP correlation, stronger wind anomalies in the NA help create the horseshoe-like SST pattern, which disrupts the ENSO influence on CA (Figure 2). This effect is further connected to the Pacific Decadal Oscillation (PDO) phase. During a positive PDO phase, a slower decaying ENSO leads to a more pronounced NA SST pattern in spring, counteracting the ENSO effect. Conversely, during a negative PDO phase, this counteracting effect weakens, leading to a stronger ENSO–SCAP relationship.

Figure. 2 Schematic diagram illustrating underlying mechanisms of interdecadal shifts in the ENSO–SCAP relationship. (a) is for fast decaying ENSO epochs and (b) is for slow decaying ENSO epochs.
Our findings shed light on the complex dynamics behind the changing ENSO–SCAP relationship. Moreover, we observe a strengthening trend in this relationship since the 2000s, suggesting that predicting spring precipitation in CA has become more reliable in recent decades. This research may offer valuable insights for regional stakeholders involved in seasonal forecasting and climate prediction in this arid region.
References
- Chen, X., Wang, S., Hu, Z., Zhou, Q. & Hu, Q. Spatiotemporal characteristics of seasonal precipitation and their relationships with ENSO in Central Asia during 1901–2013. J Geogr Sci. 28, 1341-1368 (2018).
- Chen, F., Huang, W., Jin, L., Chen, J. & Wang, J. Spatiotemporal precipitation variations in the arid Central Asia in the context of global warming. Sci China Earth Sci. 54, 1812-1821 (2011).
- Hu, Z.-Y. et al. Variations and changes of annual precipitation in Central Asia over the last century. Int J Climatol. 37 (2017).
- de Beurs, K. M., Henebry, G. M., Owsley, B. C. & Sokolik, I. N. Large scale climate oscillation impacts on temperature, precipitation and land surface phenology in Central Asia. Environ Res Lett. 13 (2018).
- Chen, Z., Wu, R., Zhao, Y. & Wang, Z. Different Responses of Central Asian Precipitation to Strong and Weak El Niño Events. J Clim. 35, 1497-1514 (2022).
Follow the Topic
-
npj Climate and Atmospheric Science

This journal is dedicated to publishing research on topics such as climate dynamics and variability, weather and climate prediction, climate change, weather extremes, air pollution, atmospheric chemistry, the hydrological cycle and atmosphere-ocean and -land interactions.
Related Collections
With Collections, you can get published faster and increase your visibility.
Modeling of Airborne Composition and Concentrations
Publishing Model: Open Access
Deadline: Mar 31, 2026
Inter-Basin Dynamics: Cross-Ocean Interactions and Decadal Forecasting
Publishing Model: Open Access
Deadline: Apr 30, 2026


Please sign in or register for FREE
If you are a registered user on Research Communities by Springer Nature, please sign in