When drought turns urban green into urban inequality
Published in Earth & Environment, Ecology & Evolution, and Sustainability
Across U.S. cities, climate extremes do not affect everyone equally. In two recent studies covering 245 major cities, we show that drought and compound climate extremes can deepen urban vegetation inequality, intensify heat exposure, and disproportionately burden already marginalized communities. These findings suggest that urban greening under climate change is not only an ecological issue, but also a question of environmental justice.
Urban vegetation is often discussed as a solution to climate risk. Trees, parks, and neighborhood green spaces can cool cities, improve environmental quality, and support human well-being. But a central question remains: when drought and extreme climate events occur, do all communities retain these benefits equally? Our recent work suggests the answer is no.
In the first study, published in npj Urban Sustainability, we examined drought-related disparities in urban vegetation degradation and associated heat exposure across major U.S. cities. Using satellite observations and census data, we found that marginalized communities tend to experience more severe vegetation degradation during drought periods. This pattern is especially pronounced in Sunbelt cities, including Southern California and Texas. We also found that unequal vegetation loss during drought can further worsen pre-existing inequalities in heat exposure. In other words, drought does not simply reduce urban greenness overall; it can also redistribute thermal risk in unequal ways.
 in drought across different sociodemographic groups.")
The spatial patterns of urban vegetation degradation (UVD) in drought across different sociodemographic groups.
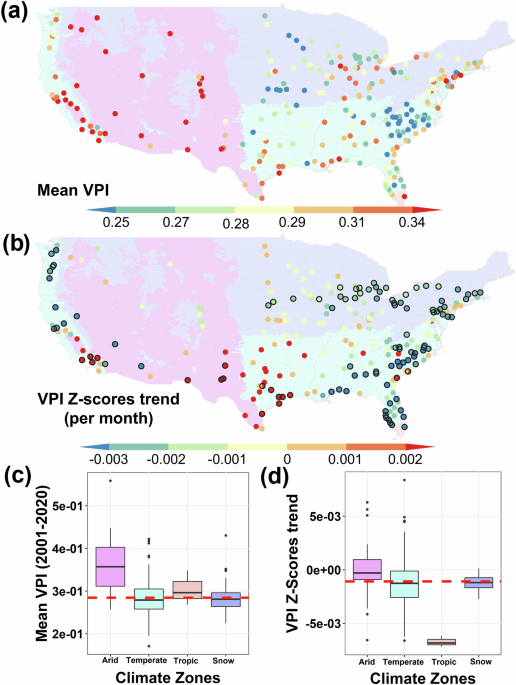
In the second study, published in npj Environmental Social Sciences, we looked beyond drought episodes to ask a broader question: how do climate extremes shape urban vegetation inequality over time? To address this, we developed a Vegetation Polarization Index (VPI), based on the contrast between the most and least vegetated parts of a city, and applied it to 245 major U.S. cities from 2001 to 2020. The results reveal a striking divergence. Sunbelt cities are more likely to see worsening vegetation inequality under drought and warmer conditions, while northern cities respond differently, with colder and wetter conditions in some cases linked to greater inequality. Particularly concerning is that hot droughts amplify vegetation inequality across almost all cities.
")
Taken together, these two studies point to a consistent message: climate change does not act on urban nature in a socially neutral way. Instead, climate extremes can interact with existing social and spatial inequalities, making some neighborhoods lose vegetation faster and face greater heat stress than others. This matters because urban vegetation is not just a visual amenity. It is part of the infrastructure that helps buffer cities against heat, and unequal access to that protection can translate directly into unequal exposure to environmental risk.
More broadly, this line of research reflects a growing need to connect urban climate science with environmental justice. For many cities, the key question is no longer simply whether to add more green space, but how to ensure that urban vegetation remains resilient under drought, and how its cooling and ecological benefits can be more equitably distributed. As heatwaves, droughts, and compound extremes become more frequent in a warming world, understanding who loses urban green first — and who bears the consequences — will be increasingly important for both science and policy.
These studies also highlight the value of integrating satellite remote sensing, climate indicators, and socioeconomic data to better understand how climate extremes reshape urban ecosystems. By linking vegetation dynamics to heat exposure and social vulnerability, we hope to contribute to a more complete picture of climate risk in cities — one that recognizes that resilience is not only about ecosystems, but also about equity.
Related papers:
Yan, Y., Dong, C. et al. Disparities in urban vegetation degradation and heat exposure during drought periods in U.S. cities. npj Urban Sustainability (published online 15 December 2025; volume 6, article 14 in 2026). https://www.nature.com/articles/s42949-025-00319-4
Yan, Y., Dong, C. et al. Divergent urban vegetation inequality in Northern and Sunbelt United States cities under climate extreme events. npj Environmental Social Sciences (published 8 April 2026; volume 1, article 2). https://www.nature.com/articles/s44432-025-00001-1
Chunyu Dong is a Professor at Sun Yat-sen University. He obtained a PhD in Hydrology at Heidelberg University (2016) and was a Postdoctoral Fellow at the University of California, Los Angeles (UCLA) from 2016 to 2019. His research focuses on AI-enabled modeling of complex geographic processes, spatial intelligence, multi-source remote sensing fusion, and intelligent early warning of water-related hazards. He has published over 70 papers in journals including Communications Earth & Environment and Remote Sensing of Environment, with applications in smart water management and regional water security.
Follow the Topic
-
npj Environmental Social Sciences
This journal will consider research that explores the intersection of environmental studies, social sciences, and policy analysis.

What are SDG Topics?
An introduction to Sustainable Development Goals (SDGs) Topics and their role in highlighting sustainable development research.
Continue reading announcement

Please sign in or register for FREE
If you are a registered user on Research Communities by Springer Nature, please sign in