Why has the tropical eastern Pacific cooled—or at least resisted warming—over the past several decades? This divergence from the general expectation of warming in response to rising greenhouse gases is fascinating in its own right. Adding to the mystery is that generations of climate models have consistently simulated the opposite: a warmer cold tongue region.
In our recent paper, “A Climate Change Signal in the Tropical Pacific Emerges from Decadal Variability,” we seek to unravel whether the local lack of warming is driven by anthropogenic forcing or internal climate variability, such as the Interdecadal Pacific Oscillation (IPO). Understanding the nature of this cooling pattern is crucial. A robust anthropogenic link would predict a cooler tropical Pacific for at least the coming decade or so mitigating global warming in the near future by enhancing ocean heat uptake and low-level cloud feedbacks. However, it is not all good news. Since the cooling pattern is also driving decadal drought in southwest North America and East Africa, this would imply continuing drought. In contrast, if the cooling is predominantly a result of cyclic internal variability, it might reverse and, even if this meant drought alleviation in the southwest and East Africa, would herald a phase of strong global warming.
Our new research supports the first possibility. We identified an emerging climate change signal in the tropical Pacific that we call the Pacific Climate Change (PCC) pattern. This is clearly distinguishable from the decadal variability of the IPO. While the IPO is associated with a meridionally broad, wedge-shaped sea surface temperature (SST) anomaly, the PCC, which has emerged since the mid-1950s, features a narrow band of cooling along the equator with warming elsewhere. The PCC emerges over time while the IPO oscillates back and forth as expected if the PCC is a signal of climate change and the IPO is natural variability. Both the PCC and IPO involve changes in thermocline depth and subsurface temperature in the upwelling regions of the central to eastern equatorial Pacific. Despite this similarity we show, using ocean data and a simple wind-driven ocean model, that the PCC’s atmosphere-ocean dynamics are fundamentally different from those of the IPO.
Using this new physics-based detection method we demonstrate that the SST trends observed during the satellite era, which have been the subject of much research, are a combination of both IPO and PCC patterns. Nonetheless, as highlighted in Figure 1, the emerging PCC trend has been strengthening. We see no reason to believe it will not continue to do so, even if the IPO’s phase shifts in the near future. Any brake on the PCC emergence will have to await the greenhouse-driven warming of the subsurface waters in the thermocline but that can take decades.
These results set a path to disentangle the tropical Pacific climate change signal from internal variability through the unique underlying dynamics of each. It provides a new physics-based benchmark for assessing the ability of climate models to reproduce the observed forced response in the presence of strong internal variability. Prior work has made clear models have trouble producing the PCC pattern calling into question their future projections of the myriad aspects of climate that depend on the tropical Pacific. We live in a world that has come to rely on model-based climate projections for adaptation and policy, so much depends on understanding the physics of the coupled ocean-atmosphere dynamics in the tropical Pacific and improving its representation in climate models to ensure more reliable projections of future regional and global climate.
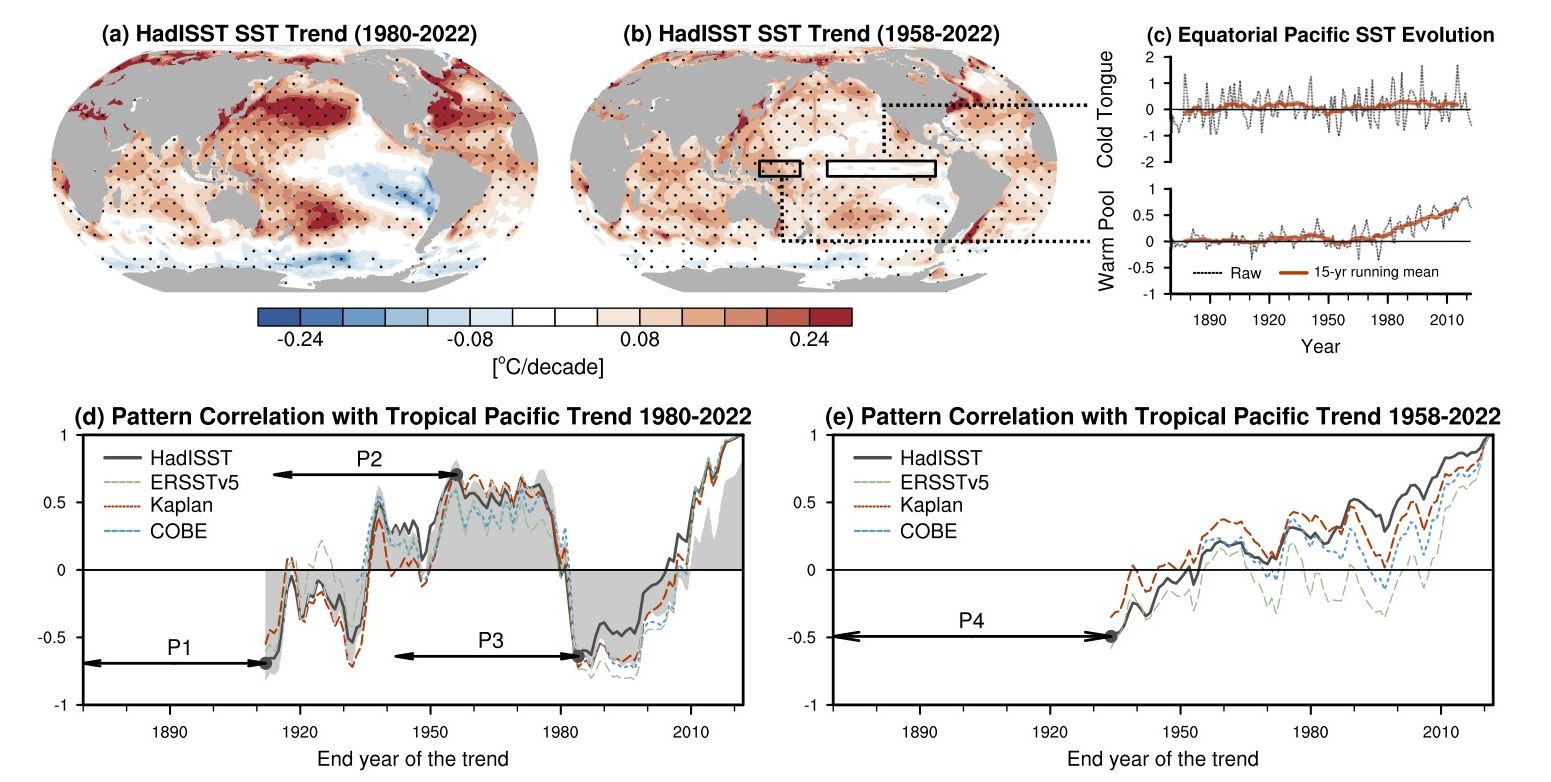
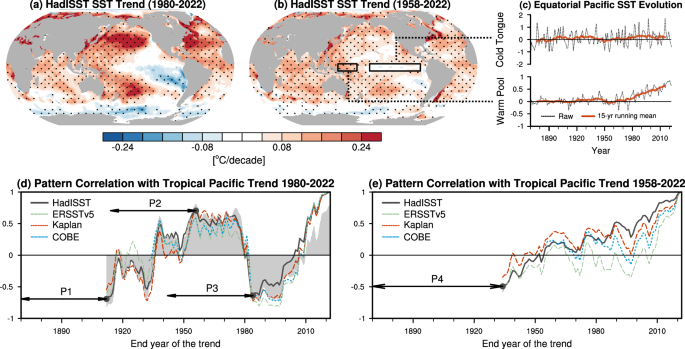
Fig. 1. Recurrent and emerging sea surface temperature (SST) trend patterns in the tropical Pacific. The SST trend (°C Per decade) based on HadISST during (a) 1980-2022 and (b) 1958-2022. Dots in (a-b) indicate the trend exceeding the 95% confidence level. (c) Timeseries of raw (black dashed lines) and 15-year running mean (red solid lines) annual-mean SST anomalies in the cold tongue (top panel; 5°S–5°N, 190°W–270°W) and the warm pool (bottom panel; 5°S–5°N, 140°E–170°W). The SST anomalies were calculated relative to the climatology of the first 50 years (1870-1919). (d) Pattern correlations of 43-year SST trends in the tropical Pacific region (30S-30N, 120E-270W) in historical period with the trend during 1980-2022 based on HadISST (black solid line), ERSSTv5 (green dashed line), Kaplan (red dotted line) and COBE (blue dashed line). Shading in (d) indicates pattern correlations of 43-year SST trends in the tropical Pacific region with the Interdecadal Pacific Oscillation (IPO) pattern based on HadISST. (e) Similar to (d) but for 65-year SST trends with the trend during 1958-2022. Arrows labeled P1 (1870-1912), P2 (1914-1956) and P3 (1942-1984) indicate the periods with strongest positive and negative correlations in (d) and P4 (1870-1934) with strongest negative correlation in (e).
Follow the Topic
-
Nature Communications
An open access, multidisciplinary journal dedicated to publishing high-quality research in all areas of the biological, health, physical, chemical and Earth sciences.

Related Collections
With Collections, you can get published faster and increase your visibility.
Women's Health
Publishing Model: Hybrid
Deadline: Ongoing
Tumor Microenvironment Crosstalk and Therapeutic Implications
Publishing Model: Hybrid
Deadline: Nov 02, 2026

Please sign in or register for FREE
If you are a registered user on Research Communities by Springer Nature, please sign in