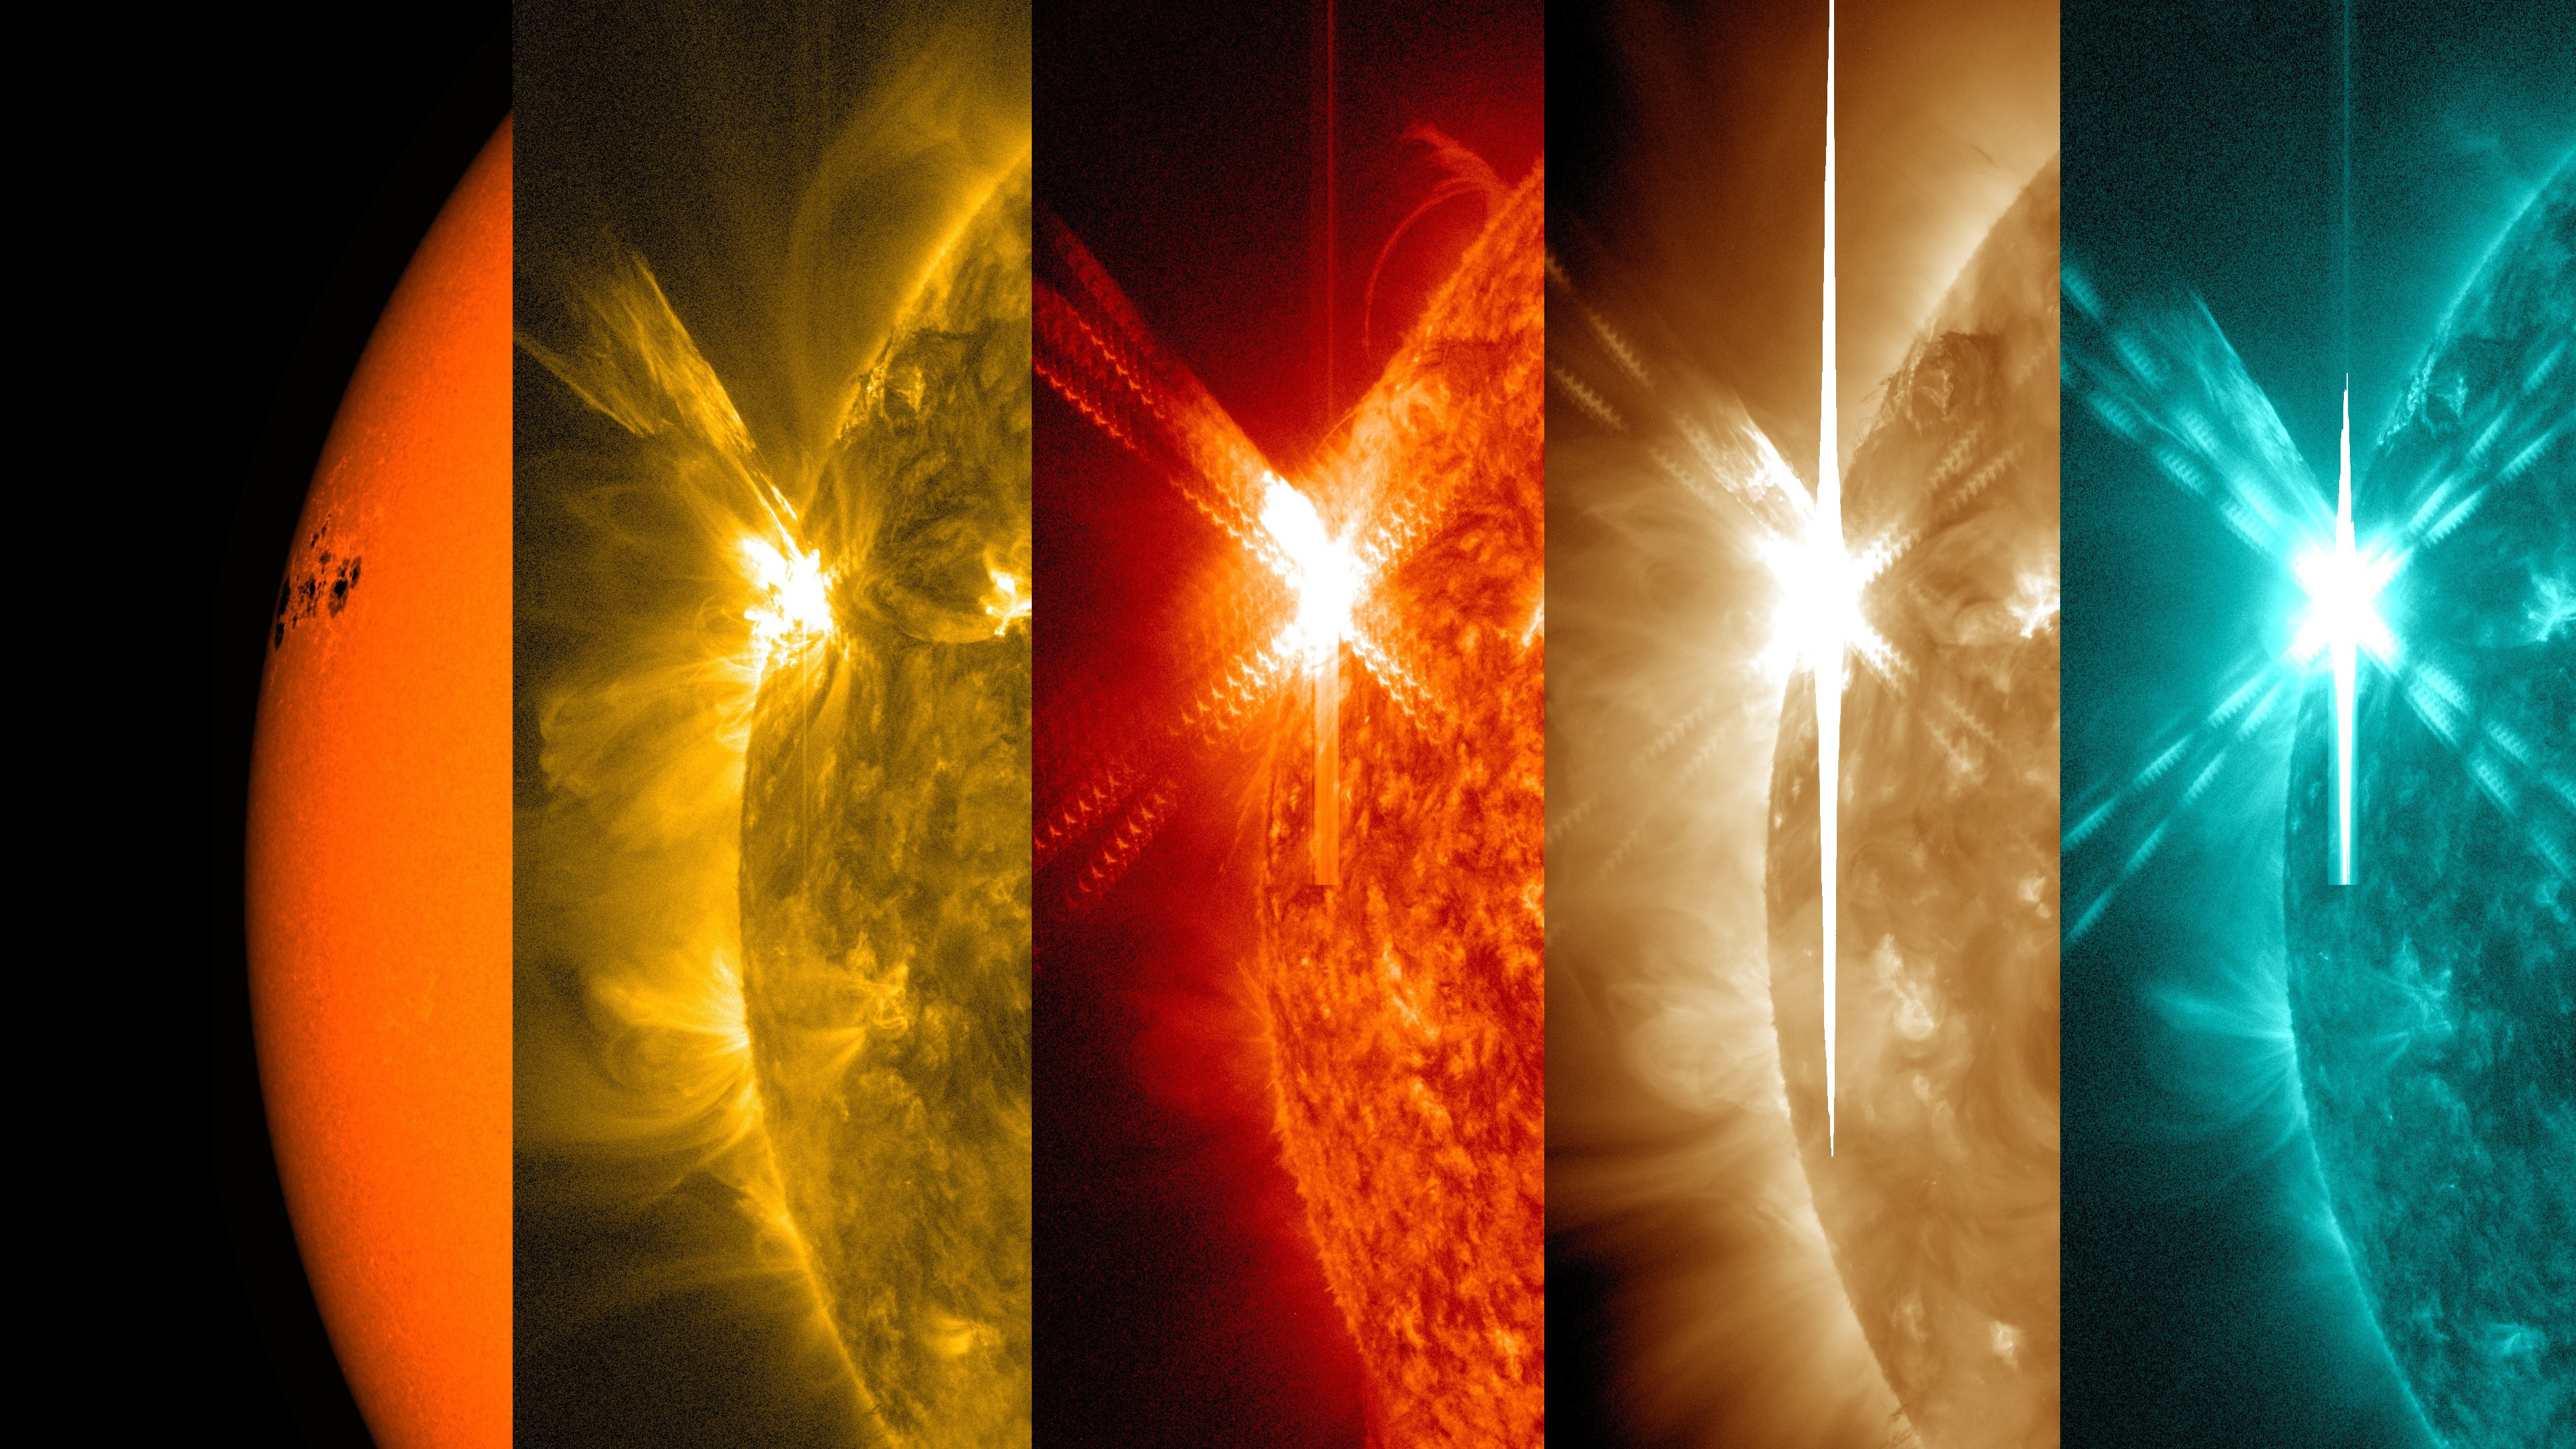
Launched in February 2010, Solar Dynamics Observatory (SDO) of NASA is designed to help us uncover where the Sun's energy comes from, how the inside of the Sun works, and how this energy is stored and released in the Sun's magnetised atmosphere. The primary instrument onboard SDO for the measurement of the solar magnetic fields is the Helioseismic and Magnetic Imager (HMI). This marvellous magnetograph has afforded us a nearly constant, low-noise, high-resolution (~360 km per pixel) and high-cadence (12 minute) database of the full magnetic field vector in the lower boundary of the solar atmosphere, the photosphere that is responsible for the vast majority of the sunlight whose energy powers the solar system.

To further facilitate the open use of its petabytes of data, the SDO/HMI has also provided the community with the HMI active region patch (HARP) data product, offering cutouts of the solar disk where most of the solar magnetic flux is accumulated. These flux conglomerations are called active regions. Most of these activity centers will emerge, evolve and fade away under nominal conditions. Some of them will be eruptive, however, responsible for the spear’s tip of adverse space whether in the solar system. Even fewer of these eruptions, known as solar flares and coronal mass ejections (CMEs), are ‘black swans’ destined to wreak havoc in the heliosphere, the Sun’s magnetohydrodynamic sphere of influence that extends far beyond the orbit of Pluto. Studying HMI’s HARPs, or their space weather version, SHARPs, poses a major challenge. At the same time, the outcome of this study is arguably our best chance to understand, and quantitatively frame, the notorious space weather forecasting problem.
Major space weather events can temporarily, for intervals of hours or days, disrupt our technological society that increasingly relies on space-based applications. Take telecommunications, the GPS, aviation, or even the electric grid at high geographic latitudes as prime examples of vulnerable sectors. Extreme space weather events threaten to severely disrupt our societal fabric for sustained periods of time because of their potentially crippling effects on sensitive technologies. Like planetary-scale earthquakes or devastating tsunamis, extreme space weather events are also extremely rare; however, it is not a question of whether, but when, they will happen. The socioeconomic impact of space weather includes not only the direct, industry-specific impacts but also the collateral effects of technology failures on dependent infrastructures and services. Space Weather Action and Strategy Plans from 2015 and the successor report from 2019 call for the improvement of space weather forecasting capabilities. One way to improve these capabilities is to make relevant data easily accessible and available to practitioners; these include not only space weather experts but also data scientists.
Along with colleagues at the Georgia State University’s Data Mining Lab we have created and made publicly available a large-scale solar active region dataset, specifically designated for space weather analytics. The dataset contains metadata from over 4,000 trajectories of solar active region patches which are integrated with carefully curated solar flare data over the best part of one full solar cycle, almost as long as the commissioning time of the SDO/HMI. Our Space Weather Data Analytics for Solar Flares (SWAN-SF) benchmark dataset is machine-learning (ML)-ready. It enables different ML tools and methods to homogeneously use certain partitions of the dataset to train, test and validate, at the same time comparing their performance precisely to determine the most promising ones. We have been compelled to believe that ML presents a potentially indispensable methodology for navigating through such Big Data landscapes and argue that our SWAN-SF dataset may make this navigation somewhat more tenable.
We are beyond excited to finally be able to share this large-scale multivariate time series dataset freely with the scientific community. With our publication in Nature Scientific Data we are releasing over 8 years (May 2010 - December 2018) of solar active region data from Solar Cycle 24. We envision that the dataset will enable exciting new predictive tools for solar flare understanding and forecasting, a key milestone in our quest for efficient space weather forecasting.
Follow the Topic
-
Scientific Data

A peer-reviewed, open-access journal for descriptions of datasets, and research that advances the sharing and reuse of scientific data.
Related Collections
With Collections, you can get published faster and increase your visibility.
Data for crop management
Publishing Model: Open Access
Deadline: Apr 17, 2026
Data to support drug discovery
Publishing Model: Open Access
Deadline: Apr 22, 2026


Please sign in or register for FREE
If you are a registered user on Research Communities by Springer Nature, please sign in