Guide to Histopathology Slide Evaluation and Digital Interpretation
Published in General & Internal Medicine
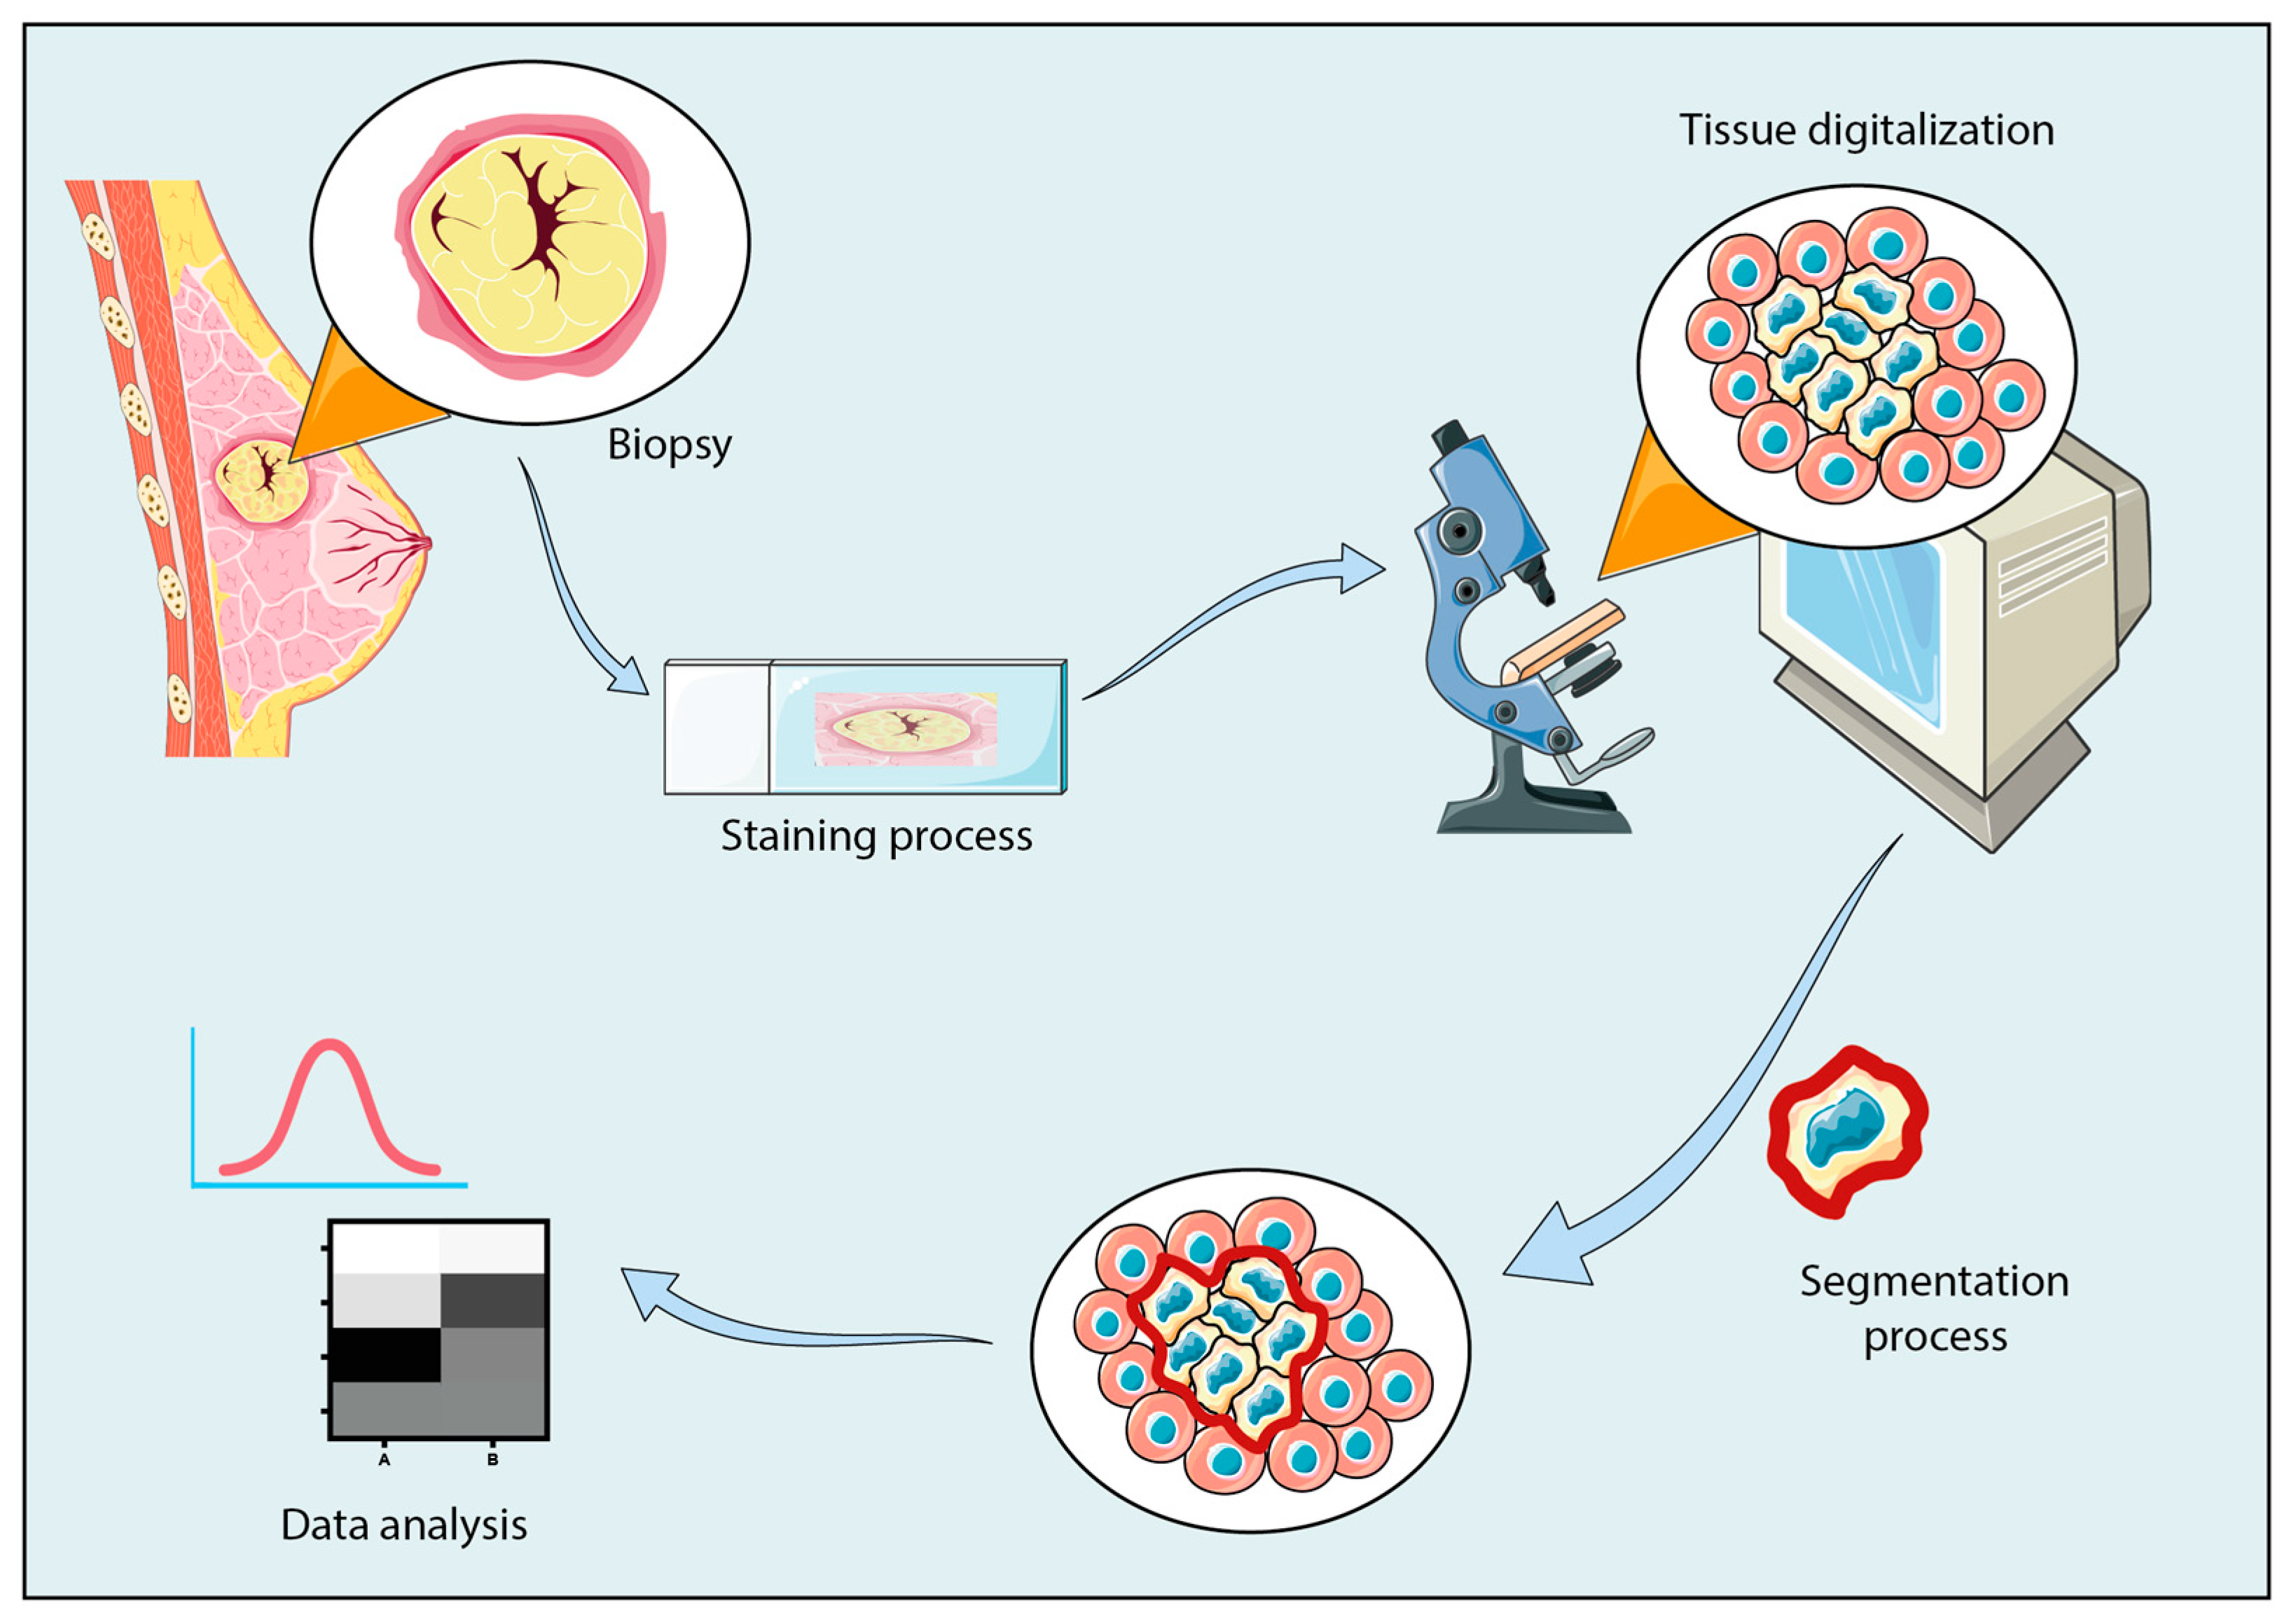
Histopathology remains the gold standard for diagnosing disease, integrating morphological, immunohistochemical, and molecular findings into one cohesive interpretation. Whether you’re using a traditional microscope or a whole-slide scanner, the process of slide analysis must be systematic, structured, and reproducible. Here’s a detailed guide to doing it the right way.
Before looking at the slide, always review the clinical history, biopsy site, and gross description. Knowing the patient’s symptoms, prior histology, and radiologic findings provides a framework for interpretation. For example, an ulcerated lesion from the lateral tongue in a chronic smoker directs your mind toward squamous dysplasia or carcinoma, while a neck node biopsy in a febrile patient might suggest granulomatous inflammation or lymphoma.
Check tissue adequacy and staining quality. When you first receive the slide, assess:
-
Fixation quality: Well-fixed tissue shows crisp nuclear detail; poor fixation causes smudgy chromatin.
-
Section thickness: Thin sections (3–5 µm) give optimal clarity.
-
Staining balance: In H&E, nuclei should appear blue to purple, cytoplasm pink, and connective tissue pale.
Digital pathology systems now allow automated quality control by detecting staining inconsistencies, tissue folds, or incomplete sections.
Start with Low-Power magnification (×2–×10). The initial scan is like reading a map before zooming in. At low power, focus on:
-
Tissue architecture: Normal versus abnormal arrangement.
-
Pattern recognition: Diffuse, nodular, papillary, glandular, or infiltrative.
-
Boundaries: Is the lesion well-circumscribed or infiltrative?
-
Necrosis, fibrosis, hemorrhage, or inflammatory distribution.
In digital pathology, this stage corresponds to whole-slide overview easily navigated and annotated on software like QuPath, ImageScope, or Philips IntelliSite. These tools allow rapid identification of “hotspots” or suspicious zones for further review.
Intermediate Magnification (×10–×20). Now, examine transitions between normal and abnormal regions, look for:
-
Cellular density and arrangement (solid, glandular, trabecular).
-
Stromal reaction (desmoplasia, inflammatory infiltrate).
-
Vascularity and necrotic foci.
-
Mitotic activity and early atypia.
At this level, you can often identify whether the lesion is benign, borderline, or malignant. Digital platforms allow you to take measurements, count mitotic figures, and even apply AI algorithms to quantify nuclear atypia.
High-Power magnification (×40–×100). At high magnification, cellular detail determines the final interpretation, evaluate:
-
Nuclear features: Shape, size, chromatin pattern, nucleoli, hyperchromasia.
-
Cytoplasm: Keratinization, vacuolation, or mucin production.
-
Mitotic figures: Normal versus atypical mitoses.
-
Cellular arrangement: Sheets, nests, glands, cords, or syncytial patterns.
-
Inflammatory cells: Lymphocytes, plasma cells, neutrophils, eosinophils, or granulomas.
High-resolution digital pathology platforms (e.g., Aperio eSlide Manager, Hamamatsu NanoZoomer, 3DHISTECH CaseViewer) now allow zooming to ×400–×600 optical quality, with built-in AI for mitotic figure detection and grading assistance.
Apply special stains and immunohistochemistry (IHC). After routine H&E interpretation, confirm the diagnosis using ancillary stains:
-
PAS, Ziehl-Neelsen, GMS for microorganisms.
-
Masson’s Trichrome for fibrosis.
-
IHC markers (e.g., CK, EMA, S100, CD20, Ki-67, p53) to define tumor lineage or proliferative index.
Digital pathology enables multiplex viewing, overlaying IHC and H&E slides for spatial comparison. Software such as HALO Image Analysis or Visiopharm provides quantitative analysis of marker expression, eliminating observer bias.
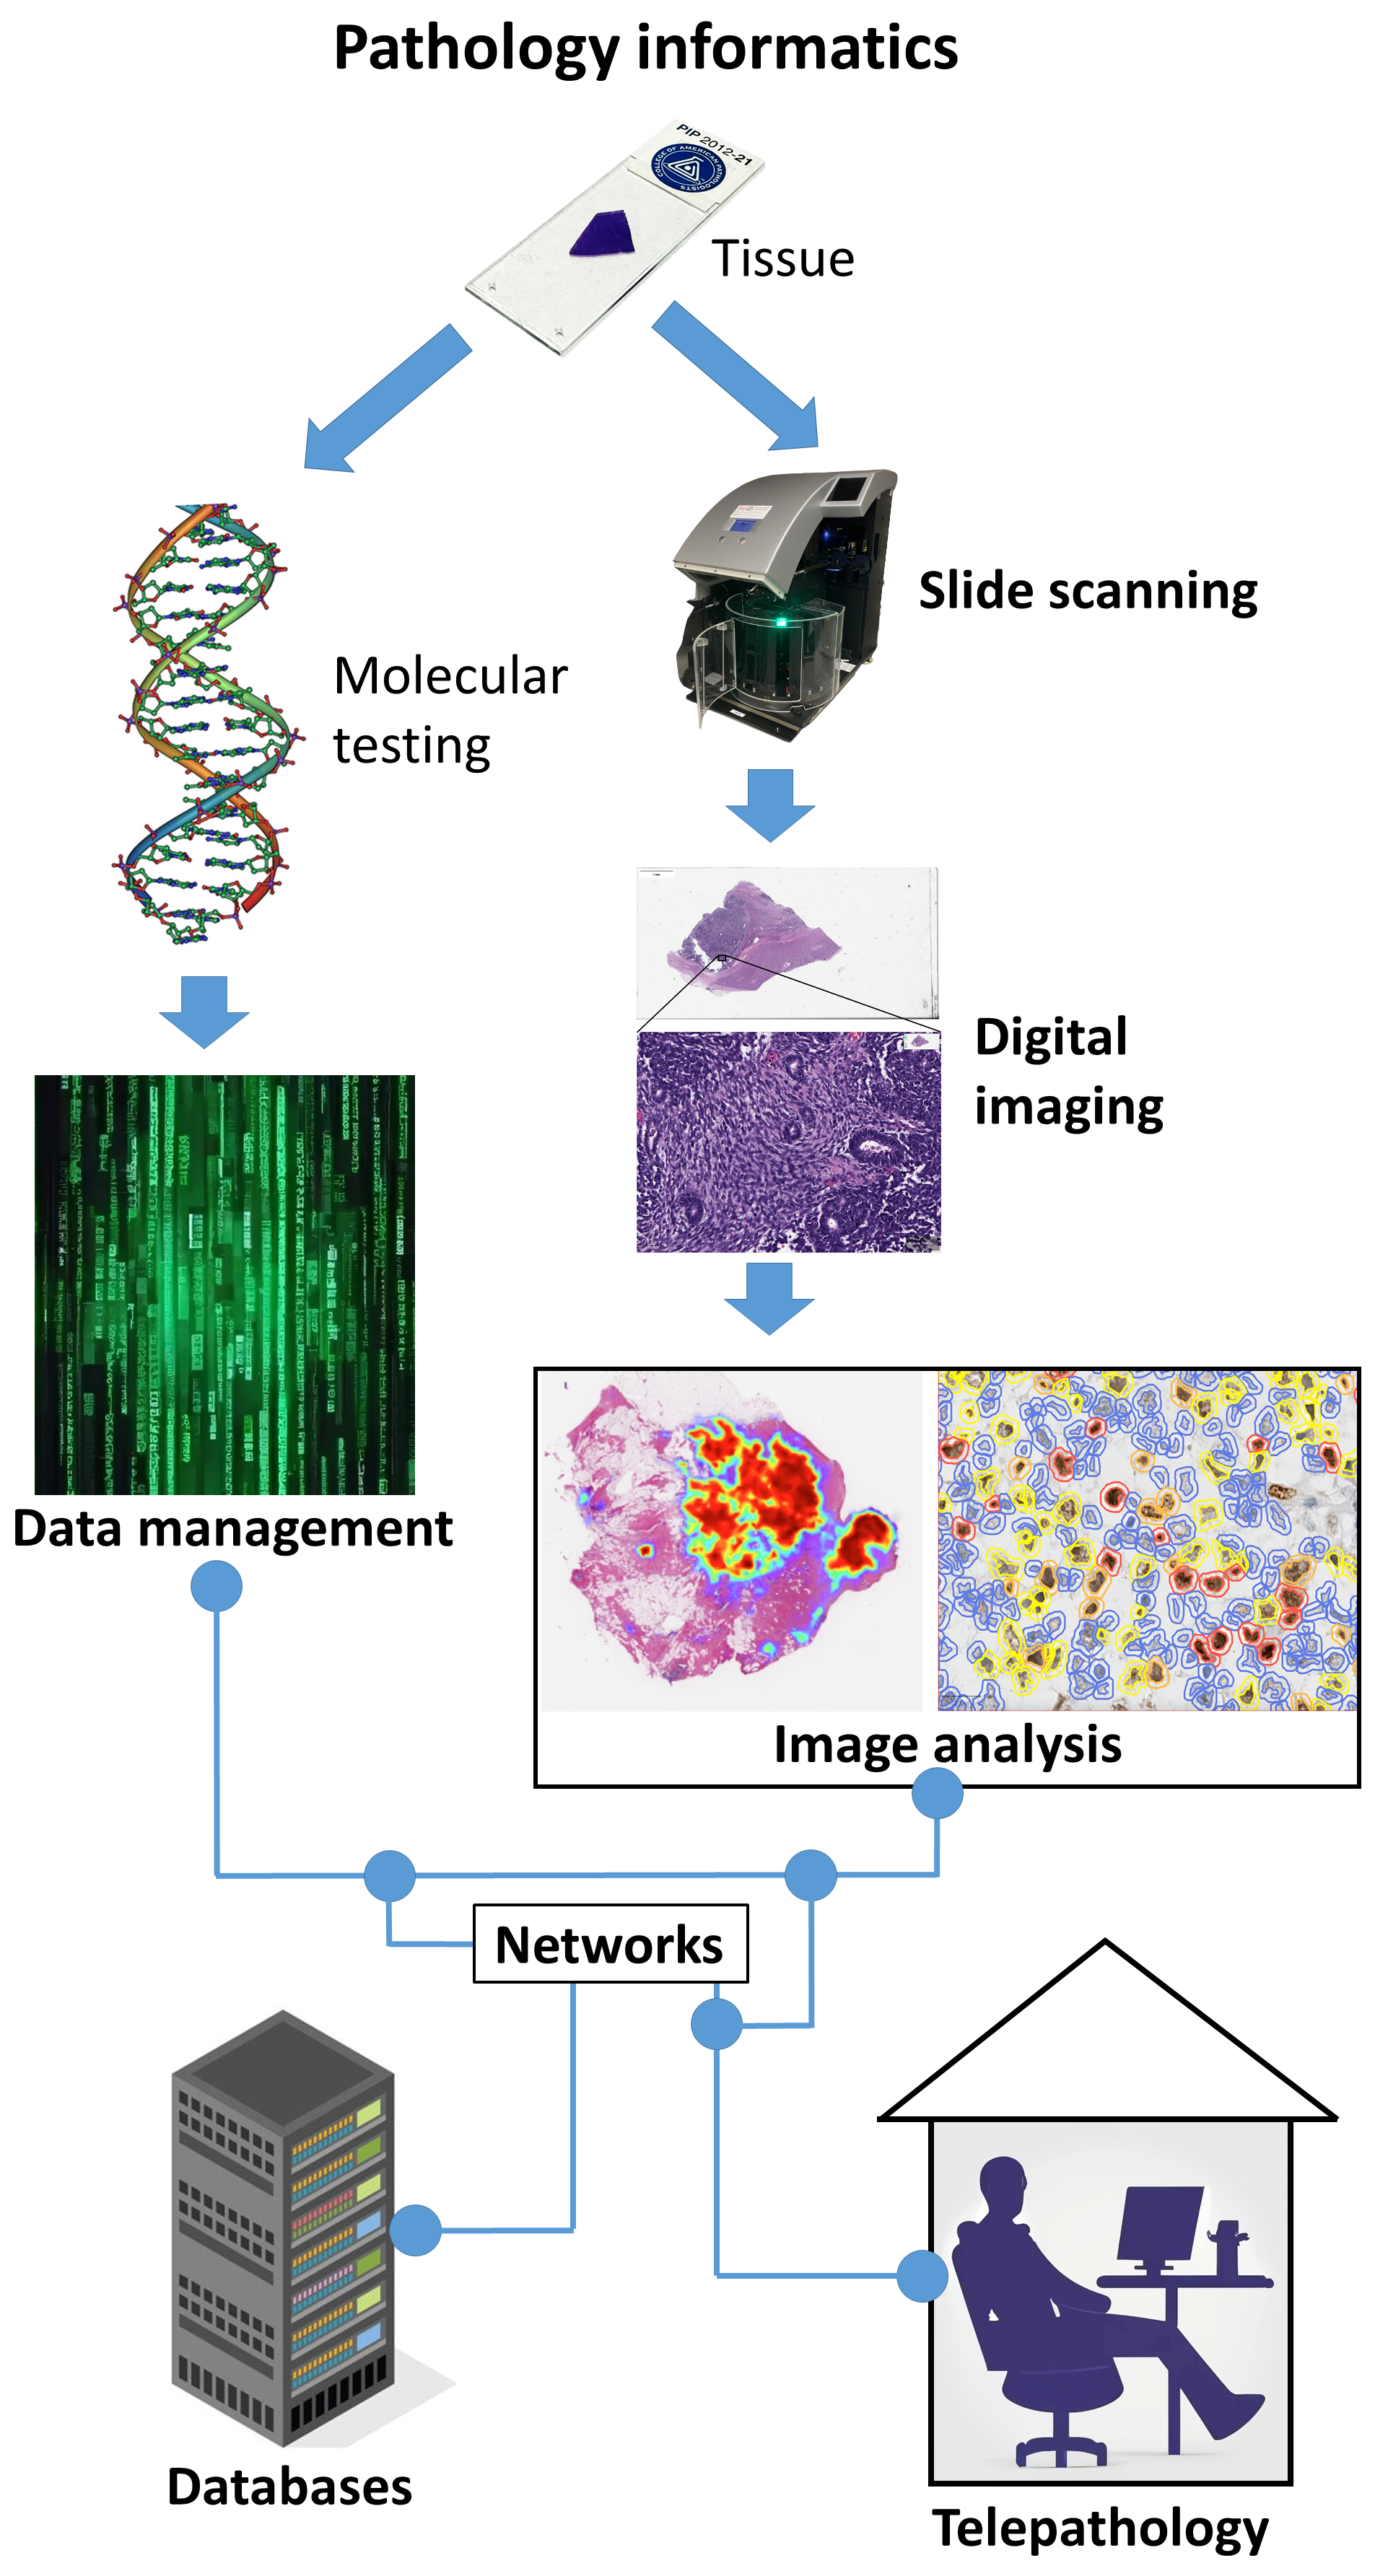
Modern pathology integrates morphology with molecular diagnostics. Techniques like PCR, FISH, NGS, and ISH validate genetic alterations (e.g., EGFR, KRAS, BRAF mutations; HPV or EBV status). A histopathological impression of “poorly differentiated carcinoma” can be refined to “HPV-positive oropharyngeal SCC” through combined analysis. Digital pathology now supports multi-omics integration, linking morphologic data to molecular profiles for AI-driven predictive modeling.
Digital pathology converts glass slides into high-resolution whole-slide images (WSI) that can be viewed, analyzed, and shared remotely. Its key advantages include:
-
Remote consultation and telepathology for second opinions.
-
AI-assisted diagnostics for detection, quantification, and grading.
-
Archival and educational use with searchable image databases.
-
Integration with LIS/LIMS for automated reporting.
Some leading digital pathology software and platforms include:
-
QuPath (Open-source) – quantitative analysis and annotation.
-
HALO (Indica Labs) – AI-driven image analysis.
-
Aperio ImageScope (Leica Biosystems) – slide navigation and comparison.
-
3DHISTECH CaseViewer – multi-layer viewing and teaching modules.
-
Visiopharm – high-end image quantification and AI modeling.
Digital pathology is now merging with computational pathology and machine learning, enabling predictive diagnostics, outcome modeling, and integration with molecular data marking the evolution of pathology from descriptive to data-driven precision science.
Reporting and documentation. A well-structured report should include:
-
Specimen details (type, site, adequacy).
-
Microscopic description (architecture, cytology, pattern).
-
Diagnosis (definitive or differential).
-
Correlation with IHC/molecular findings.
-
Comment on grading, staging, and prognosis.
Digital pathology platforms often allow automated report generation and integration with patient records, improving workflow efficiency and traceability.


Please sign in or register for FREE
If you are a registered user on Research Communities by Springer Nature, please sign in