Site-specific optimal air temperature for vegetation photosynthesis across the globe
Published in Ecology & Evolution and Plant Science
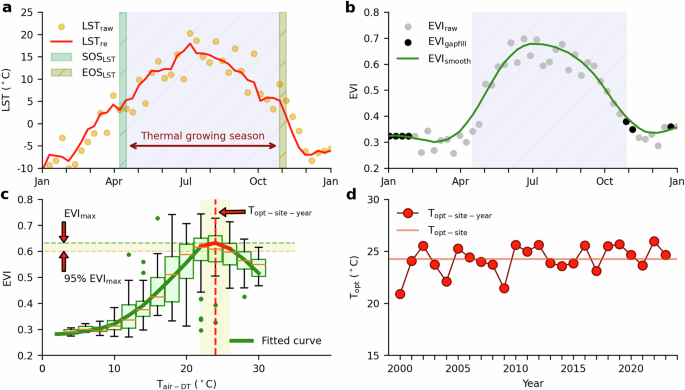
An increase in air temperature generally enhances the rate of photosynthesis, but excessively high temperatures can cause stomatal closure and enzyme deactivation, thereby reducing photosynthesis. Consequently, the response of Gross Primary Production (GPP) to air temperature typically exhibits a parabolic shape or an unimodal curve. The optimal temperature for vegetation photosynthesis (Topt) is the air temperature at which vegetation reaches its maximum photosynthetic rate under specific climatic conditions. Topt is a crucial temperature parameter in most terrestrial ecosystem models. Traditionally, these models use biome-specific Topt (Topt-biome), derived from a limited number of site-specific analyses within each biome. However, recent studies have highlighted significant discrepancies between Topt-biome parameters and the actual observed site-specific Topt (Topt-site), primarily due to vegetation's adaptation and acclimation to local climate conditions (Fig. 1).
.")
Fig. 1. Histogram of Topt-site within 14 biomes. The red dot lines present the Topt-biome from the look-up table (Raich, Rastetter et al. 1991, McGuire, Melillo et al. 1992).
We utilized MODIS-derived Enhanced Vegetation Index (EVI) and ERA5 climate data from 2000 to 2019 to estimate and generate Topt-site data products globally at a 500-m spatial resolution to address this issue (Fig. 2). Our analysis revealed substantial variation in Topt-site among individual pixels within a biome, underscoring the inadequacy of the widely used Topt-biome to represent this heterogeneity. This global dataset of Topt-site parameter estimates provides a more accurate reflection of vegetation responses to local climatic conditions. The adoption of Topt-site in ecosystem models is expected to significantly enhance the accuracy of GPP simulations, offering better insights into the impacts of climate change on terrestrial ecosystems.
 global map of Topt-site-year in 2000; (c) global map of Topt-site, derived from the median value of Topt-site-year from 2000 to 2019; (e) Topt-std is calculated as the standard deviation of Topt-site-year during the period. The global map only shows the area where annual NDVI larger than 0.1. The histogram represents the proportion of pixels within the different intervals, as shown on the x-axis. The red line represents the Kernel Density Estimation (KDE). (b), (d), and (f) correspond to the average values across latitude gradient in (a), (c), and (e), respectively. The solid black lines are calculated as the average value for all pixels within 1° of latitude, and the shadow indicates the standard deviation.")
Fig. 2. Global maps of optimal air temperature and interannual variation. (a) global map of Topt-site-year in 2000; (c) global map of Topt-site, derived from the median value of Topt-site-year from 2000 to 2019; (e) Topt-std is calculated as the standard deviation of Topt-site-year during the period. The global map only shows the area where annual NDVI larger than 0.1. The histogram represents the proportion of pixels within the different intervals, as shown on the x-axis. The red line represents the Kernel Density Estimation (KDE). (b), (d), and (f) correspond to the average values across latitude gradient in (a), (c), and (e), respectively. The solid black lines are calculated as the average value for all pixels within 1° of latitude, and the shadow indicates the standard deviation.
Follow the Topic
-
Scientific Data
A peer-reviewed, open-access journal for descriptions of datasets, and research that advances the sharing and reuse of scientific data.

Related Collections
With Collections, you can get published faster and increase your visibility.
Computer vision in plant science and agriculture
Publishing Model: Open Access
Deadline: Oct 10, 2026
Wearable and Computer Vision Data for Health and Behaviour Research
Publishing Model: Open Access
Deadline: Aug 08, 2026


Please sign in or register for FREE
If you are a registered user on Research Communities by Springer Nature, please sign in