Spatial partitioning of terrestrial precipitation reveals varying dataset agreement across different environments
Published in Earth & Environment
About half a millennium has passed since humanity's first attempt to study the water cycle. It was at the height of the Renaissance when one of its perhaps most famous representatives investigated how water moves from the atmosphere to the surface of our planet, how it changes forms from liquid to gas or solid, and how it interacts with the environment and landscape. Leonardo da Vinci, though not remembered for his hydrological pursuits, was the first to theoretically conceptualize what thousands of scientists later studied as the hydrological cycle. So, if we were to seek the source behind our research endeavor conducted five centuries later, it would likely trace back to the personal notebooks of the ingenious engineer.
Since then, much has changed. The theoretical knowledge and observation methods regarding changes in the hydrological cycle have progressed, offering us, for the first time in human history, the ability to have global high-resolution measurements in time and space. Now, we can estimate global rainfall at spatial resolutions of tens of kilometers and temporal scales of half an hour, facilitated by the development of both satellite technologies and computational simulation models. Their combination provides us with an exceptionally clear picture of the hydrological cycle from across the entire globe. Or does it not?
When we began working on the ITΗΑCA research project, aiming to study changes in the water cycle due to planetary warming, we assumed that the plethora of modern available data could provide a clear estimate of water movement to and from the Earth's surface. This would subsequently assist us in comparing recent and past fluctuations, as well as future projections, with the current conditions. Among all the changes in the water cycle, we selected atmospheric precipitation, i.e., rainfall and snowfall, as it has been measured more extensively and accurately than any other meteorological variable.
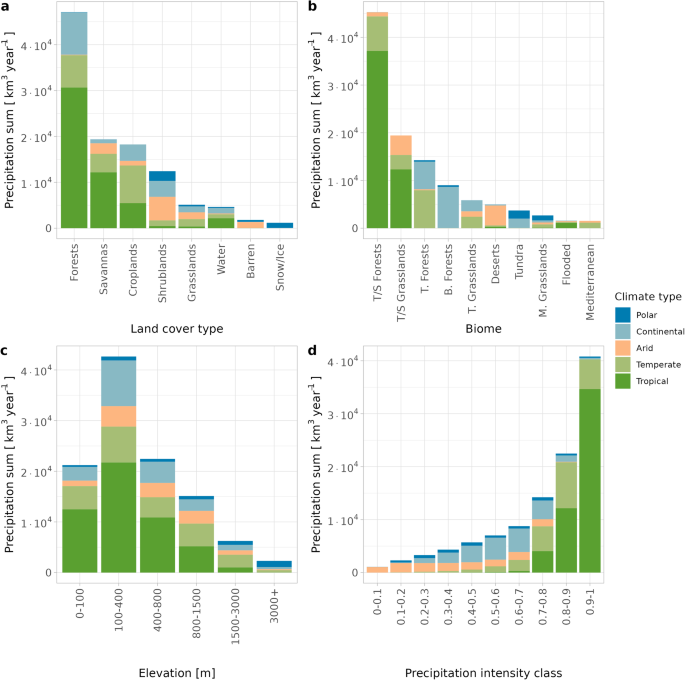
There, we encountered a first surprise. We discovered that while there are over two hundred scientific studies estimating global precipitation amount, how this precipitation is distributed across the Earth's surface according to the characteristics of each region has not yet been calculated. How much water falls on the mountains? How much on croplands? How much in tropical forests and how much in arid steppes? To answer these and similar questions related to atmospheric precipitation in different land uses, ecosystem types, and elevation, we used seventeen datasets over the first two decades of the 21st century. However, at this point, we were faced with a second surprise.
.")
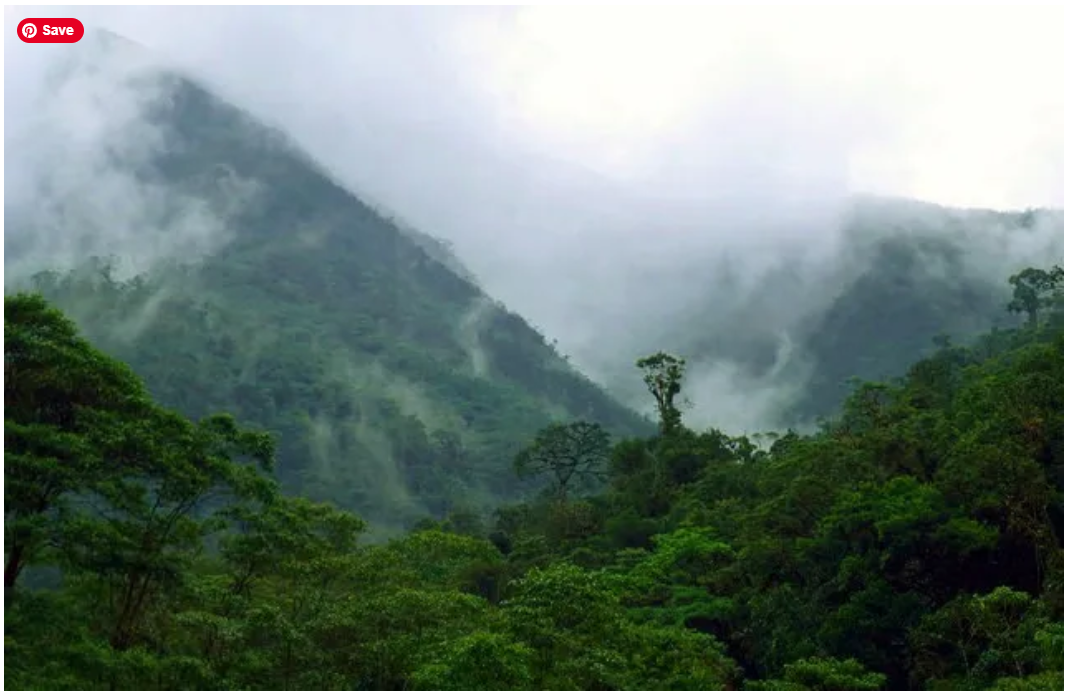
When we compared the range of values between our data, we observed significant discrepancies. While expected, as they originate from different sources, it particularly struck us that in some cases the differences far exceeded the known values. For example, in regions with a semi-tropical climate like Nairobi in Kenya or La Paz in Bolivia, the differences could be up to three times the observed value. Similarly, mountainous areas exhibited a wider range of values (e.g., Rocky Mountains 200 - 1200 mm annually), while significant deviations were also observed in tropical regions, such as Southeast Asia where annual rainfall ranged from 1000 to 2000 mm. For this reason, we decided to further investigate this discrepancy between the data and map the apparent uncertainty on a global scale.
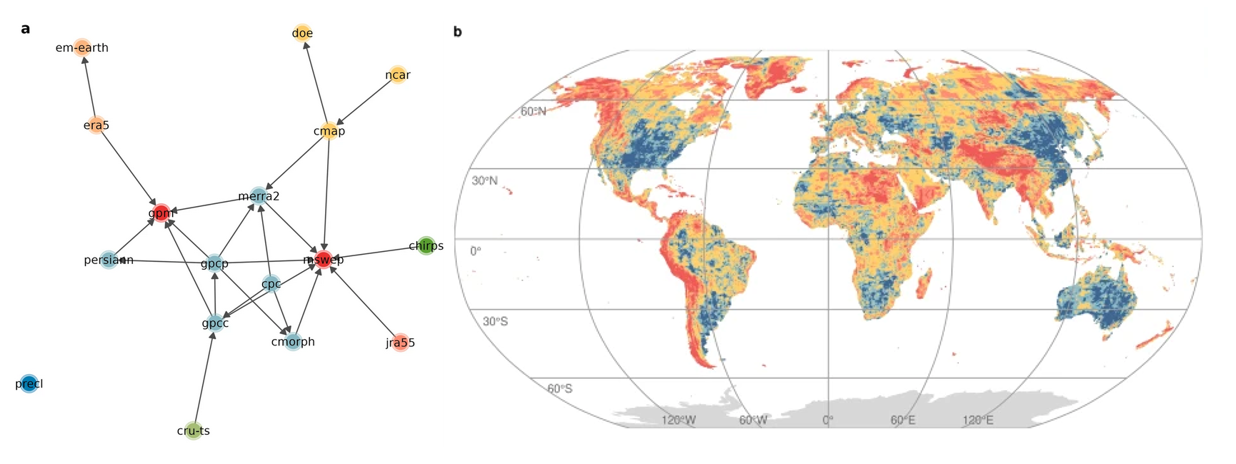
There is a belief that since all these datasets are directly or indirectly related to ground measurement stations, they can be evaluated accordingly. And indeed, what we noticed is that areas with meteorological stations show significantly greater agreement among the data. However, we often overlook that the stations cover only 5% of the Earth's land. Thus, ultimately, the datasets are evaluated in areas with meteorological stations (which are usually used) that represent a very small fraction of the total surface they describe. Therefore, for most of the planet, what we have at our disposal is not different measurements but alternative estimates of reality. This brings us face to face with the two-clock problem.
There is a century old quote saying: "A man with a watch knows what time it is. A man with two watches is never sure." In our case, we had seventeen clocks, and while their makers claimed to give the exact time, in some cases, some reported noon and others midnight. The usual practice in these cases would be to calculate the average. However, this approach has two significant drawbacks. Firstly, it is not realistic in cases of large differences. The average value of the desert and the temperate climate is not the subtropical climate, just as the afternoon is not the average of noon and midnight. Also, although our data comes from different sources, many of them use similar primary measurements or similar methodologies. Calculating the average may introduce some bias towards "data families" with common characteristics.
To check this, we identified the genealogy of the data, capturing the correlations during their creation. As expected, new questions arose. How should data with common genealogies be represented in the estimation of a region's average rainfall? Does the new generation of data always offer better estimates than the previous one? And if so, how should we handle the situation when there are significant disagreements in these new estimates? If we consider that there is "democracy" among the data, then there is a risk that dissenters, even if they are right, may not be heard. If we a priori assume that some datasets are better than others based on subjective criteria, then we become vulnerable to the personal bias of each scientist.
Obviously, there is no easy answer to this issue. In our case, we decided to present these questions and highlight how they affect the distribution of atmospheric precipitation in different environments. We showed that the greatest disagreement occurs in areas with low rainfall and/or high altitude. Conversely, temperate regions show the greatest agreement, while in the tropical zone, the following paradox occurs. Due to high rainfall, although there is relative agreement, their absolute differences often exceed those of other regions. The difference between the data of the order of 600 mm in the Amazon, where the average rainfall is 2500 mm, is not that impactful when compared to the same difference in La Paz, which receives 800 mm annually. Our results show to what extent and where we can rely on global data on atmospheric precipitation. Returning to the two-clock problem, we could say that the first clock indicates what a clock does, while the second reminds us of what it cannot do.
Thus, at the end of our study, we were able to calculate not only how much snow falls on the planet's mountains or how much rain reaches our tropical forests but also to present the range of uncertainty in each case. By identifying the genealogy and correlations of the datasets, we offer future researchers an entry point for similar studies, as it is certain that datasets will continue to grow. Perhaps the greatest surprise awaited us at the end when we compared the total amount of atmospheric precipitation reaching the ground with the estimates of the last century. Despite the limited means and measurements available to the research pioneers at the beginning of the twentieth century, they were extremely close to the values we calculate today. We can imagine the justification they would feel today and see perhaps Leonardo smiling as water continues its eternal journey.
Follow the Topic
-
Communications Earth & Environment
An open access journal from Nature Portfolio that publishes high-quality research, reviews and commentary in the Earth, environmental and planetary sciences.

Related Collections
With Collections, you can get published faster and increase your visibility.
Remote sensing and forests
Publishing Model: Hybrid
Deadline: Jul 31, 2026
Sustainable agricultural practices
Publishing Model: Open Access
Deadline: Oct 31, 2026


Please sign in or register for FREE
If you are a registered user on Research Communities by Springer Nature, please sign in