The changing relationship between cell phone mobility and COVID-19
Published in Healthcare & Nursing

Overview: At the onset of the COVID-19 pandemic there was intense interest in modeling the spread of infections to help inform policy decisions, such as the efficacy of lockdowns and when it was safe to reopen. Instead of directly modeling the effects of government policies on COVID-19 spread, analyzing aggregate cell phone mobility trends due to its promise in providing a more direct proxy for the volume of risky person-to-person interactions quickly became popular. Interest was in how changes in such volume impacted the spread of COIVD-19. Indeed, using data from the first several months of the pandemic many works illustrated that reductions in mobility were associated with decreased COVID-19 infection rates [1-3, 5-7]. Nonetheless, it was unclear whether these findings would be stable over future waves of the pandemic as the effect of other interventions like masks and social distancing became more prevalent due to changing guidance from the CDC. As a result, questions remained as to whether this information could help inform policy.
When we started our work in late summer 2020, we were interested in addressing questions like: Should mobility play a role in reopening or in imposing lockdowns? Is increased mobility associated with increased transmission in the face of behavioral changes due to changing mask use and social distancing guidance? Do early findings from the first wave of the pandemic in urban areas still broadly apply to future waves and to rural areas outside of major metropolitan areas?
In our work [4], we show that the relationship between mobility and infection incidence changes over time and geography and that conclusions on the association between mobility and infection incidence are sensitive to underlying modeling assumptions. In contrast to earlier works, we consider county-level data across the US instead of just major cities, and we model data from February 2020-February 2021, a much longer time period of the pandemic than previously considered.
To assess the effect of aggregate mobility on the COVID-19 incidence rate, we fit a multi-level regression model where the weekly growth rate of new COVID-19 infections in a county is explained using weekly county-level mobility, state mask use, temperature, and county population. To allow the effect of mobility to vary over time, we divide the year into four “waves” of 13 weeks and constrain the effect of mobility to be constant within each wave. Additionally, this effect is constant across counties that are within the same geographic area (defined through Combined Statistical Areas (CSAs) from the US Census).
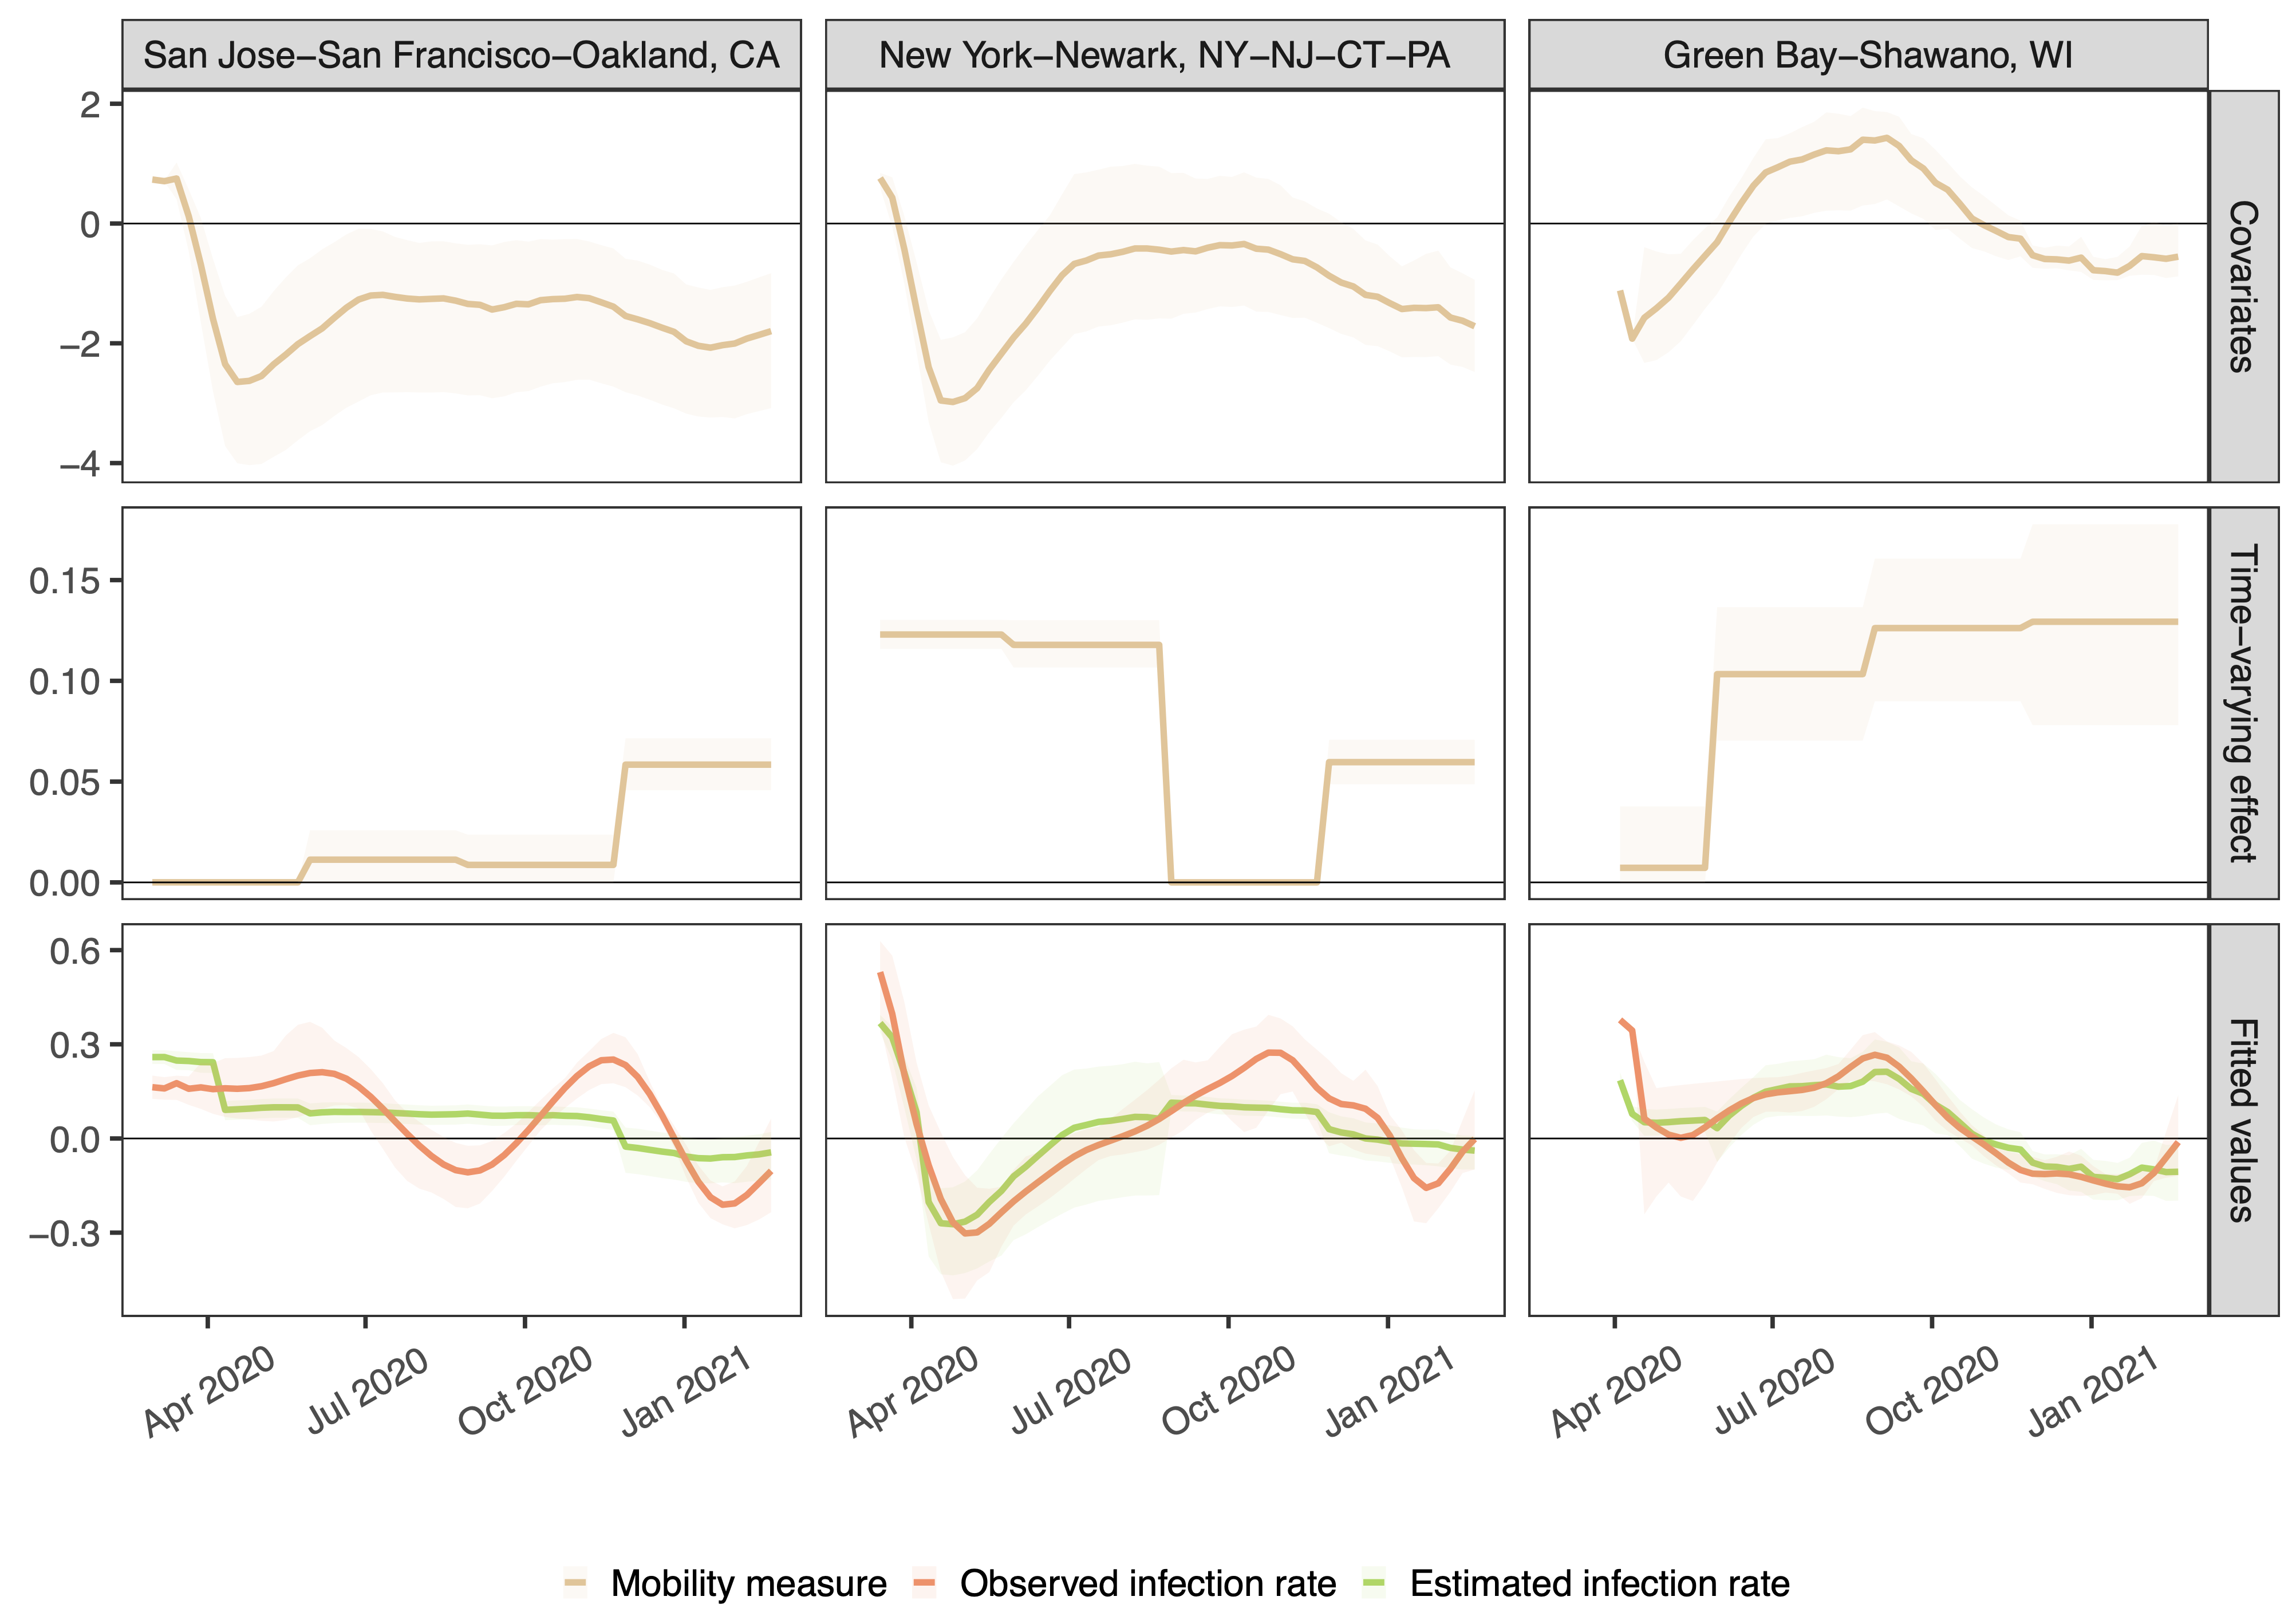
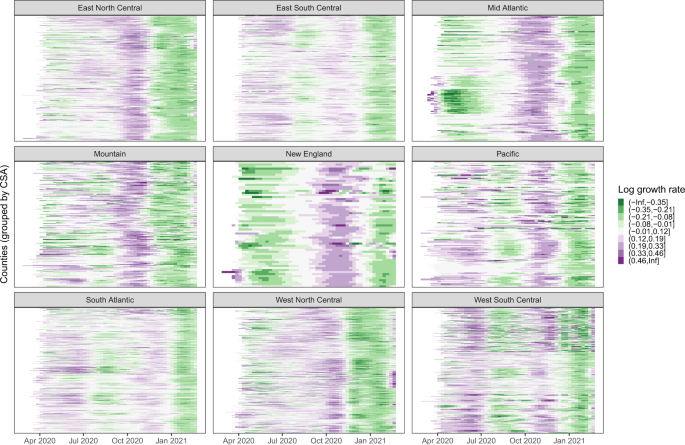
Using one year of data across 94% of all 3142 US counties corresponding to 99.7% of the population, we corroborate early findings that drops in mobility were associated with decreased COVID-19 incidence rates in the most populous counties in spring 2020. However, we show that this relationship is highly variable across time and geography. In Figure 1, we show cell phone mobility values, the estimated time varying effect between mobility and infection incidence, and the estimated model predictions for three illustrative metropolitan areas. We see that the estimated effect of mobility (second row) varies over time and by place. Figure 2 zooms out and displays aggregate model performance. Our model had the highest predictive power in spring 2020 in high population areas and especially in the Northeast. This relatively high predictive power dissipated as the pandemic evolved.


Due to the large spatiotemporal variability in the association, we conclude that cell phone mobility data is not a reliable predictor for the county level COVID-19 incidence rate, which may have important policy implications. There are several caveats to our analyses.
Data quality: We rely on data that’s publicly available for the underlying county-level COVID-19 case counts. These data are subject to non-stationary testing artifacts that are difficult to adjust for in our modeling. The mobility data is a coarse measure of county-level aggregate movement that cannot capture how individual interactions occur (i.e., masked or not, socially-distanced, outside, etc.). Moreover, we have poor mask adherence data, especially at the start of the pandemic, that is based on three one-time surveys and a daily Facebook survey starting in September. We also note that our study ended before widespread vaccine availability, and before the emergence of novel, more infectious variants of the virus.
Predictive model limitations: Ideally to answer any of these questions we would want a causal model linking mandates and mobility (among other mechanisms) to the infection incidence rate. Compartmental models, where the evolution of subgroups of the population---say, susceptible, infected, infectious, and recovered groups---are explicitly modeled could help to better understand causal mechanisms that could be intervened on. However, we do not have the data in order to identify and estimate such models without making strong assumptions. Instead, we are left with simpler statistical models that help us understand associations between variables. This problem space is very complicated and even simple statistical models are difficult to use to make conclusions between coarse measures of mobility and infection spread.
Please read our paper [4] for additional information!
References
[1] Badr, H. S. et al. Association between mobility patterns and COVID-19 transmission in the USA: a mathematical modelling study. Lancet Infect. Dis. 20, 1247–1254 (2020).
[2] Chang, S. et al. Mobility network models of COVID-19 explain inequities and inform reopening. Nature 589, 82–87 (2021).
[3] IHME COVID-19 Forecasting Team. Modeling COVID-19 scenarios for the United States. Nat. Med. (2020).
[4] Jewell, S., Futoma, J., Hannah, L. et al. It’s complicated: characterizing the time-varying relationship between cell phone mobility and COVID-19 spread in the US.npj Digit. Med. 4, 152 (2021). https://doi.org/10.1038/s41746-021-00523-3
[5] Unwin, H. J. T. et al. State-level tracking of COVID-19 in the United States. Nat. Commun.11, 1–9 (2020)
[6] Xiong, C. et al. Mobile device data reveal the dynamics in a positive relationship between human mobility and COVID-19 infections. Proc. Natl Acad. Sci. 117, 27087–27089 (2020).
[7] Zhou, Y. et al. A spatiotemporal epidemiological prediction model to inform county-level COVID-19 risk in the United States. Harvard Data Science Review (2020).
Follow the Topic
-
npj Digital Medicine

An online open-access journal dedicated to publishing research in all aspects of digital medicine, including the clinical application and implementation of digital and mobile technologies, virtual healthcare, and novel applications of artificial intelligence and informatics.
Related Collections
With Collections, you can get published faster and increase your visibility.
Digital Health Equity and Access
Publishing Model: Open Access
Deadline: Mar 03, 2026
Evaluating the Real-World Clinical Performance of AI
Publishing Model: Open Access
Deadline: Jun 03, 2026


Please sign in or register for FREE
If you are a registered user on Research Communities by Springer Nature, please sign in