Forest regeneration can help us adapt to a warming world
Published in Earth & Environment
Climate change is accelerating, and with it, our need for effective adaptation strategies. Forest regeneration has emerged as a powerful tool, not only for capturing atmospheric carbon, but also for regulating local climates. However, forests play a dual role in altering local temperature—sometimes cooling, sometimes warming—which can challenge our ability to use them to counter changes in a warming world. Yet, many governments, NGOs, and private sector organizations are promoting forest regeneration globally. This highlights the need for a deeper understanding of how forest regeneration can be strategically implemented to not only maximize carbon sequestration but also enhance local climate resilience.
In our study, titled “Natural forest regeneration is projected to reduce local temperatures”, we asked, can natural forest regeneration effectively lower local temperatures? And if so, how does this cooling effect vary across different regions of the world? To address these questions, we used machine learning techniques and remote sensing data to explore how naturally regenerating forests impact local climate (i.e., land surface temperature) by altering albedo (i.e., the reflectivity of forests) and evapotranspiration (i.e., the release of water from a forests). While forest regeneration can lower albedo, leading to potential local warming by absorbing more sunlight, it also increases evapotranspiration, which cools the local climate.
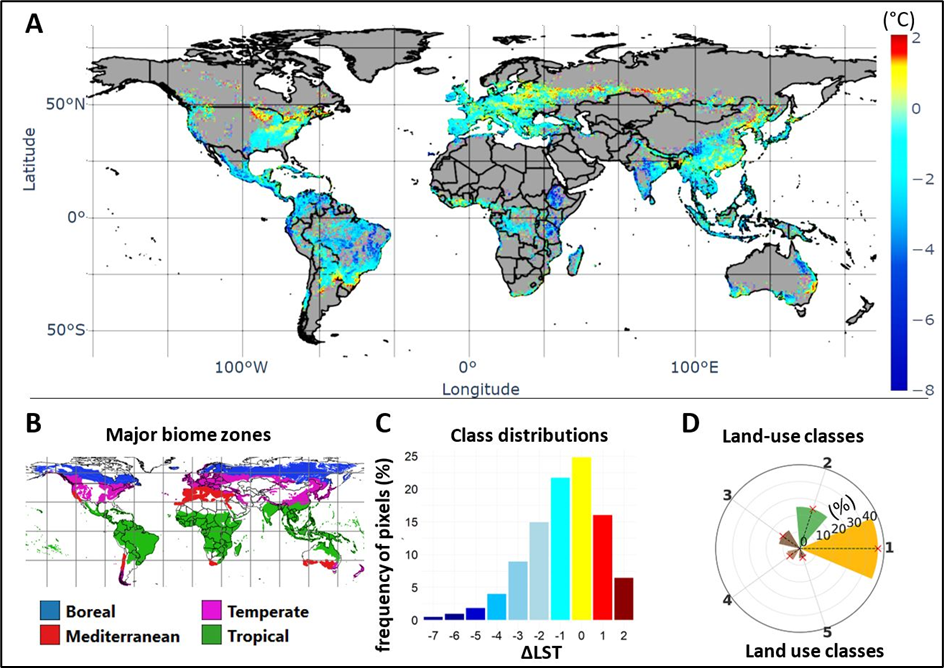
The results were encouraging (Fig. 1). Across much of the tropical, temperate, and Mediterranean regions, natural forest regeneration has the potential to significantly reduce local temperatures. For example, in tropical areas, our models predict cooling of up to 2.03°C—a substantial effect, in regulating the local climate. However, the impacts are not uniform. In boreal regions, which are colder and snow-covered, natural forest regrowth may lead to warming due to changes in albedo, where snow-covered open areas reflect more sunlight than forested areas. These variations emphasize the region-specific effects of forest regeneration.
While some estimate that the global potential for natural forest regeneration is vast, covering around 1 billion hectares, it is not feasible to regenerate all this land due to competing land-use needs. Therefore, we also explored a more focused scenario, covering 148 million hectares, where forest regeneration could be prioritized, considering biodiversity conservation and food security. Importantly, we found that natural regeneration could lower land surface temperature across 64% of 1 billion hectares and 75% of 148 million hectares of potentially restorable land.
With climate change leading to more frequent and intense heatwaves, understanding where forest regeneration is likely to reduce temperatures is critical. Our findings provide critical information for planners and policymakers to identify areas where forest regeneration can offer the most benefit for local cooling.
This knowledge is also crucial for developing regionalized approaches to forest restoration. By identifying areas where regeneration provides the greatest benefits, we can prioritize efforts not only for carbon sequestration but also for climate adaptation. Natural forest regeneration holds significant promise, but careful planning is key. Our research helps to optimize reforestation for benefits to both people and nature.

Fig. 1. Predicted change in land surface temperature (ΔLST) following natural forest regeneration. A) This figure illustrates the expected variation in ΔLST (°C), calculated as the difference between the predicted LST after forest regeneration and the currently observed LST. The analysis focuses on regions identified as having restoration potential and presents data at a 1-km spatial resolution. B) Location of major biome zones, including Boreal, Mediterranean, Temperate, and Tropical regions. C) Class distributions of predicted change in ΔLST, where the y-axis represents the percentage distribution of pixel frequencies across a range of values from -8 to 2 and a label i on the x-axis represents the interval [i-1 °C, i °C[ of ΔLST values. D). Land use classes in potential areas for natural forest regeneration. Class 1 (savanna: 46.37%), class 2 (grassland: 24.77%), class 3 (croplands, 12.46%), class 4 (cropland/natural vegetation mosaic: 7.52%), and class 5 (Woody Savannas, 5.63%); other classes (less than 4%) are not depicted in the figure. In both A and C, red colors indicate places where natural regeneration would lead to local warming, blue colors indicate cooling, and yellow indicates no change.
Follow the Topic
-
Communications Earth & Environment

An open access journal from Nature Portfolio that publishes high-quality research, reviews and commentary in the Earth, environmental and planetary sciences.
Related Collections
With Collections, you can get published faster and increase your visibility.
Archaeology & Environment
Publishing Model: Hybrid
Deadline: Mar 31, 2026
Drought
Publishing Model: Hybrid
Deadline: Mar 31, 2026


Please sign in or register for FREE
If you are a registered user on Research Communities by Springer Nature, please sign in