How much of the inter-decadal climate transition over eastern China is attributable to internal variability and how much is due to external forcing?
Published in Earth & Environment

The observed annual precipitation showed a clear inter-decadal transition over eastern China during the second half of the 20th century, characterized by a long-term drying trend in North China and a wetting trend in South China. The inter-decadal transition of the dipole pattern commonly referred to as the “south flood–north drought” (SFND) pattern and has major impacts on water resources, agriculture, ecosystems and human society in eastern China.
Many studies have investigated the impacts of internal climate variability (e.g., Pacific Decadal Oscillation, Atlantic Multi-decadal Oscillation) and external forcing (e.g., greenhouse gases, aerosols, volcanic activity, land use and land cover change) on the SFND pattern. However, the relative contribution of internal variability and external forcing to this inter-decadal transition of precipitation/temperature pattern remains unclear. The attribution of the phase transition in inter-decadal variations of regional climate is hindered by the inability of coupled atmosphere-ocean models to capture the observed temporal evolution of climate.
We tried to separate internal variability from the externally forced climate response through a set of dynamical downscaling simulations with lateral boundary conditions derived from reanalysis data and a large ensemble mean of the CMIP5 historical simulations. In doing so, we successfully isolated the response of the regional climate to the global internal climate variability and external forcing.
The regional model simulation driven by ERA40 reanalysis dataset was able to capture the observed dipole pattern of the precipitation and the corresponding temporal variation (Fig. 1). The inter-decadal transition of the SFND pattern is dominated by the internal climate variability. In contrast, external forcing tends to cause a drying trend over eastern China which can be further attributed to the increasing anthropogenic aerosol.
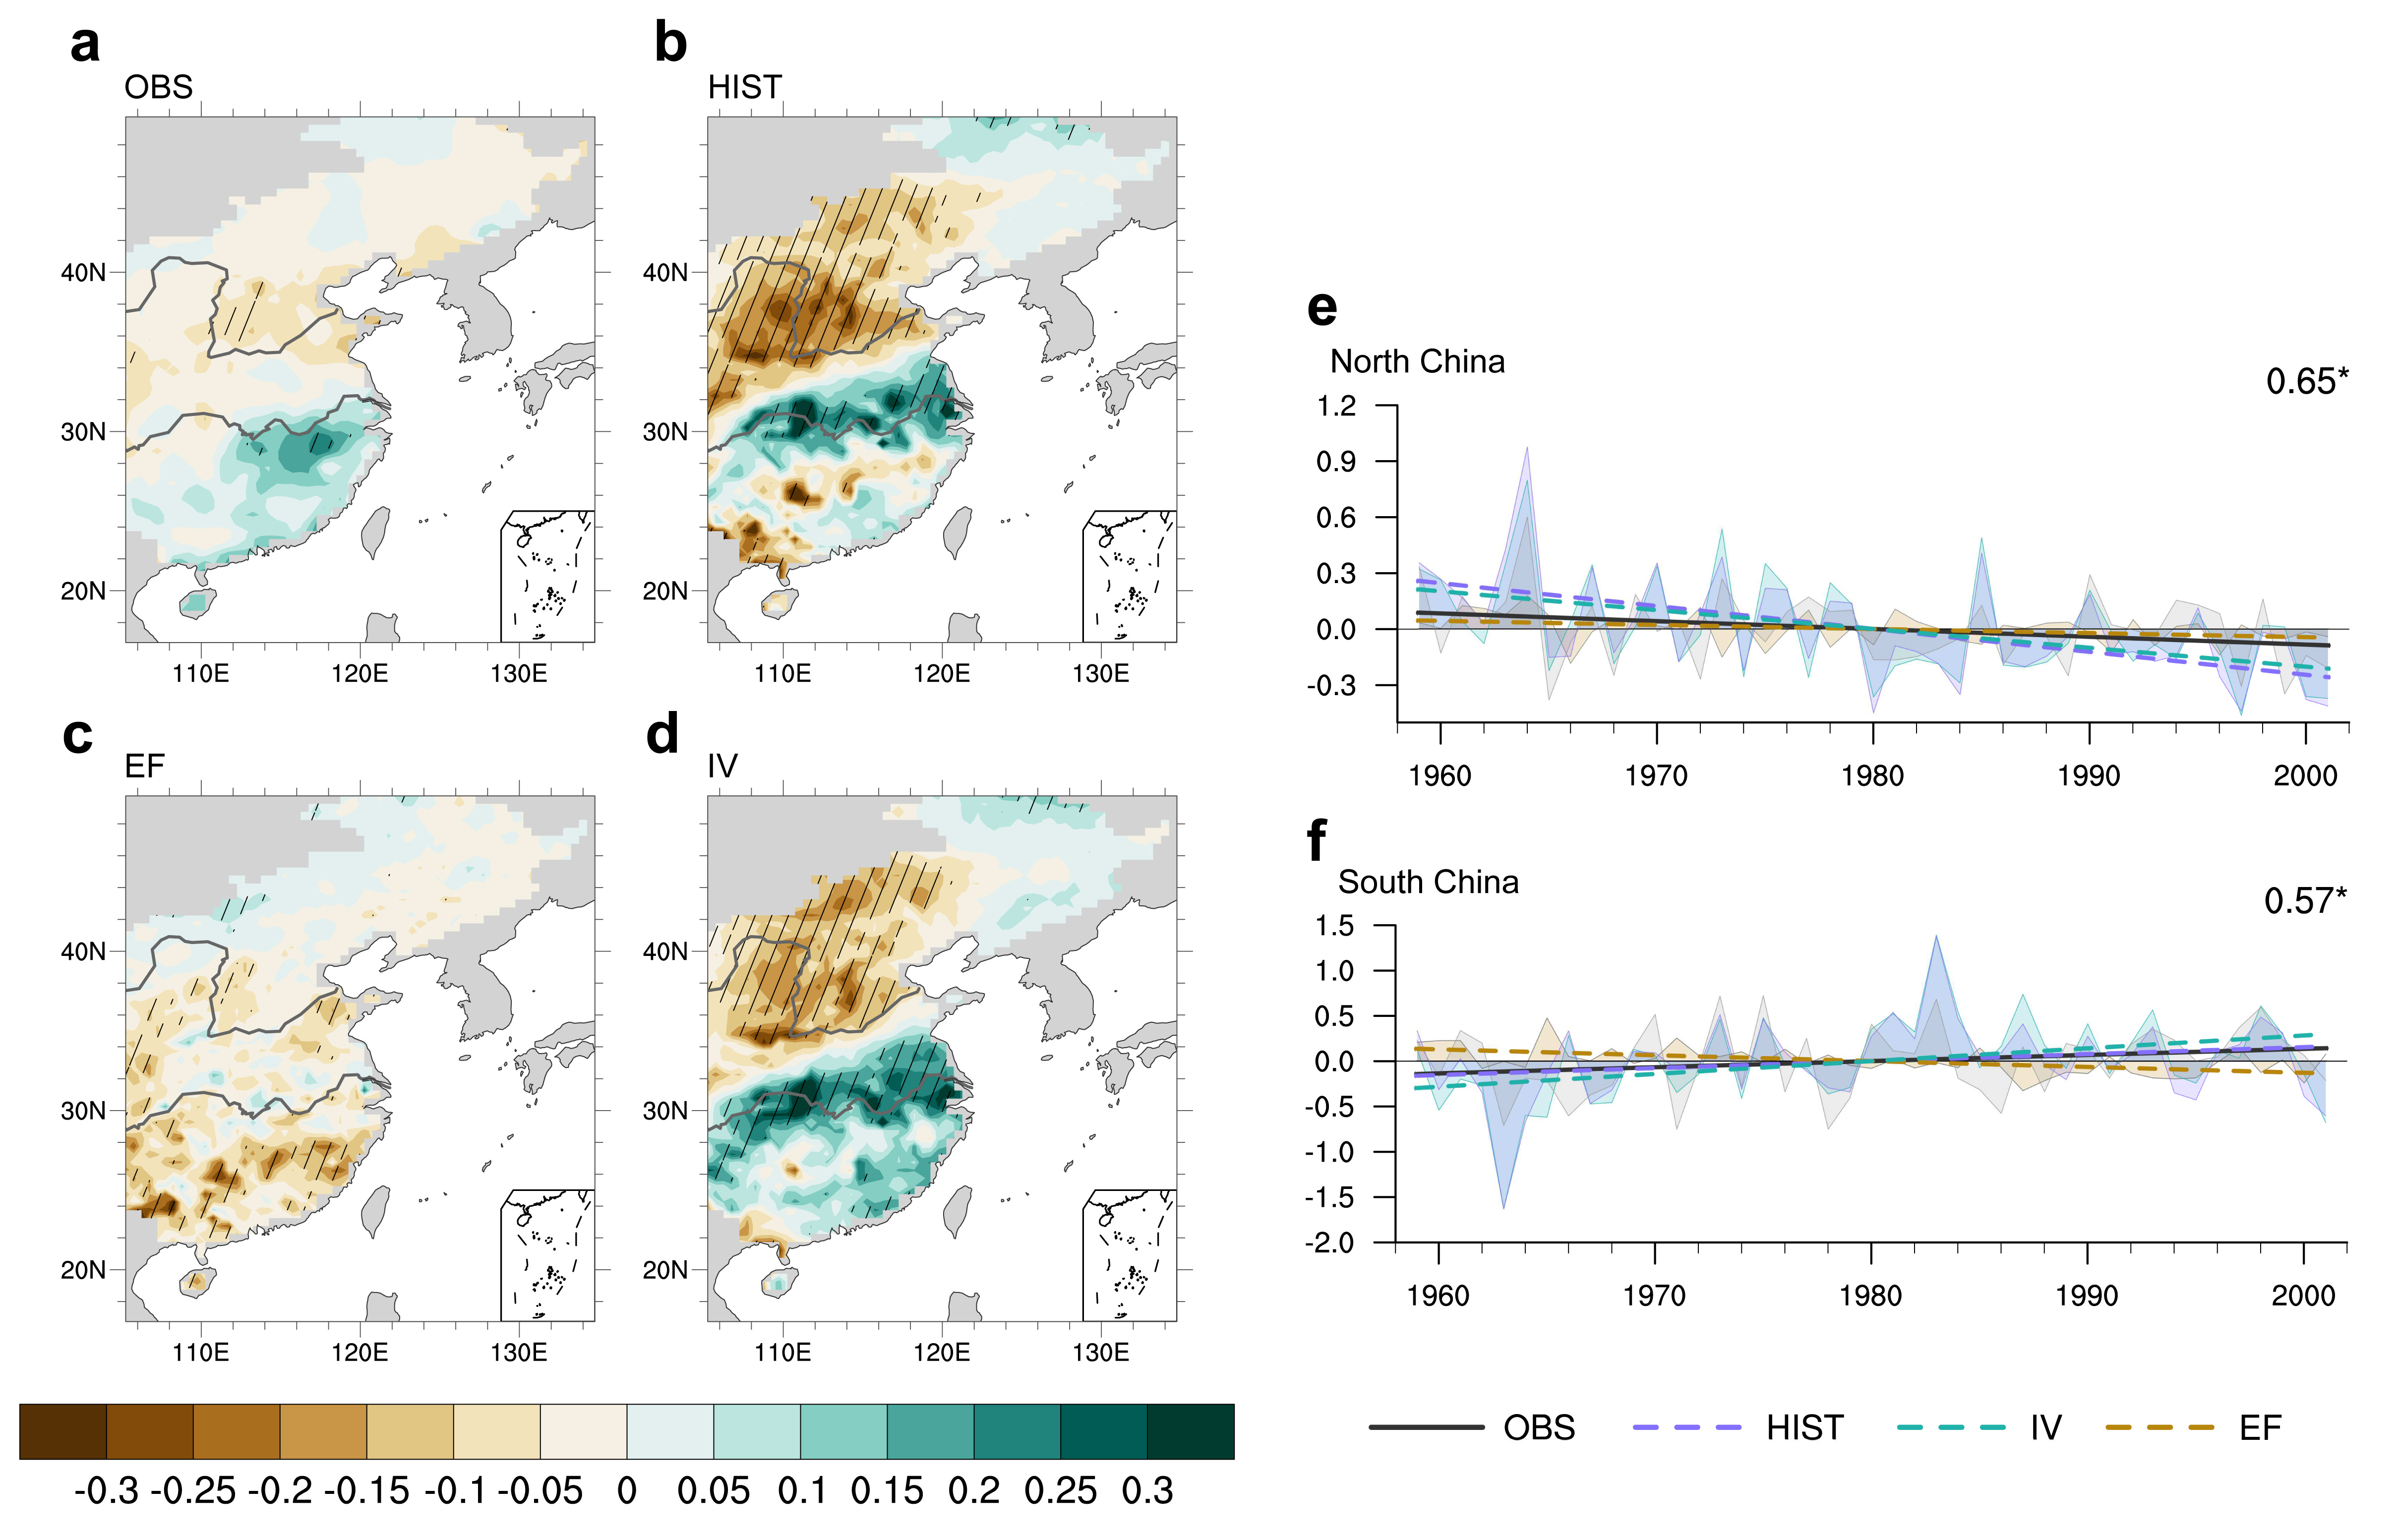
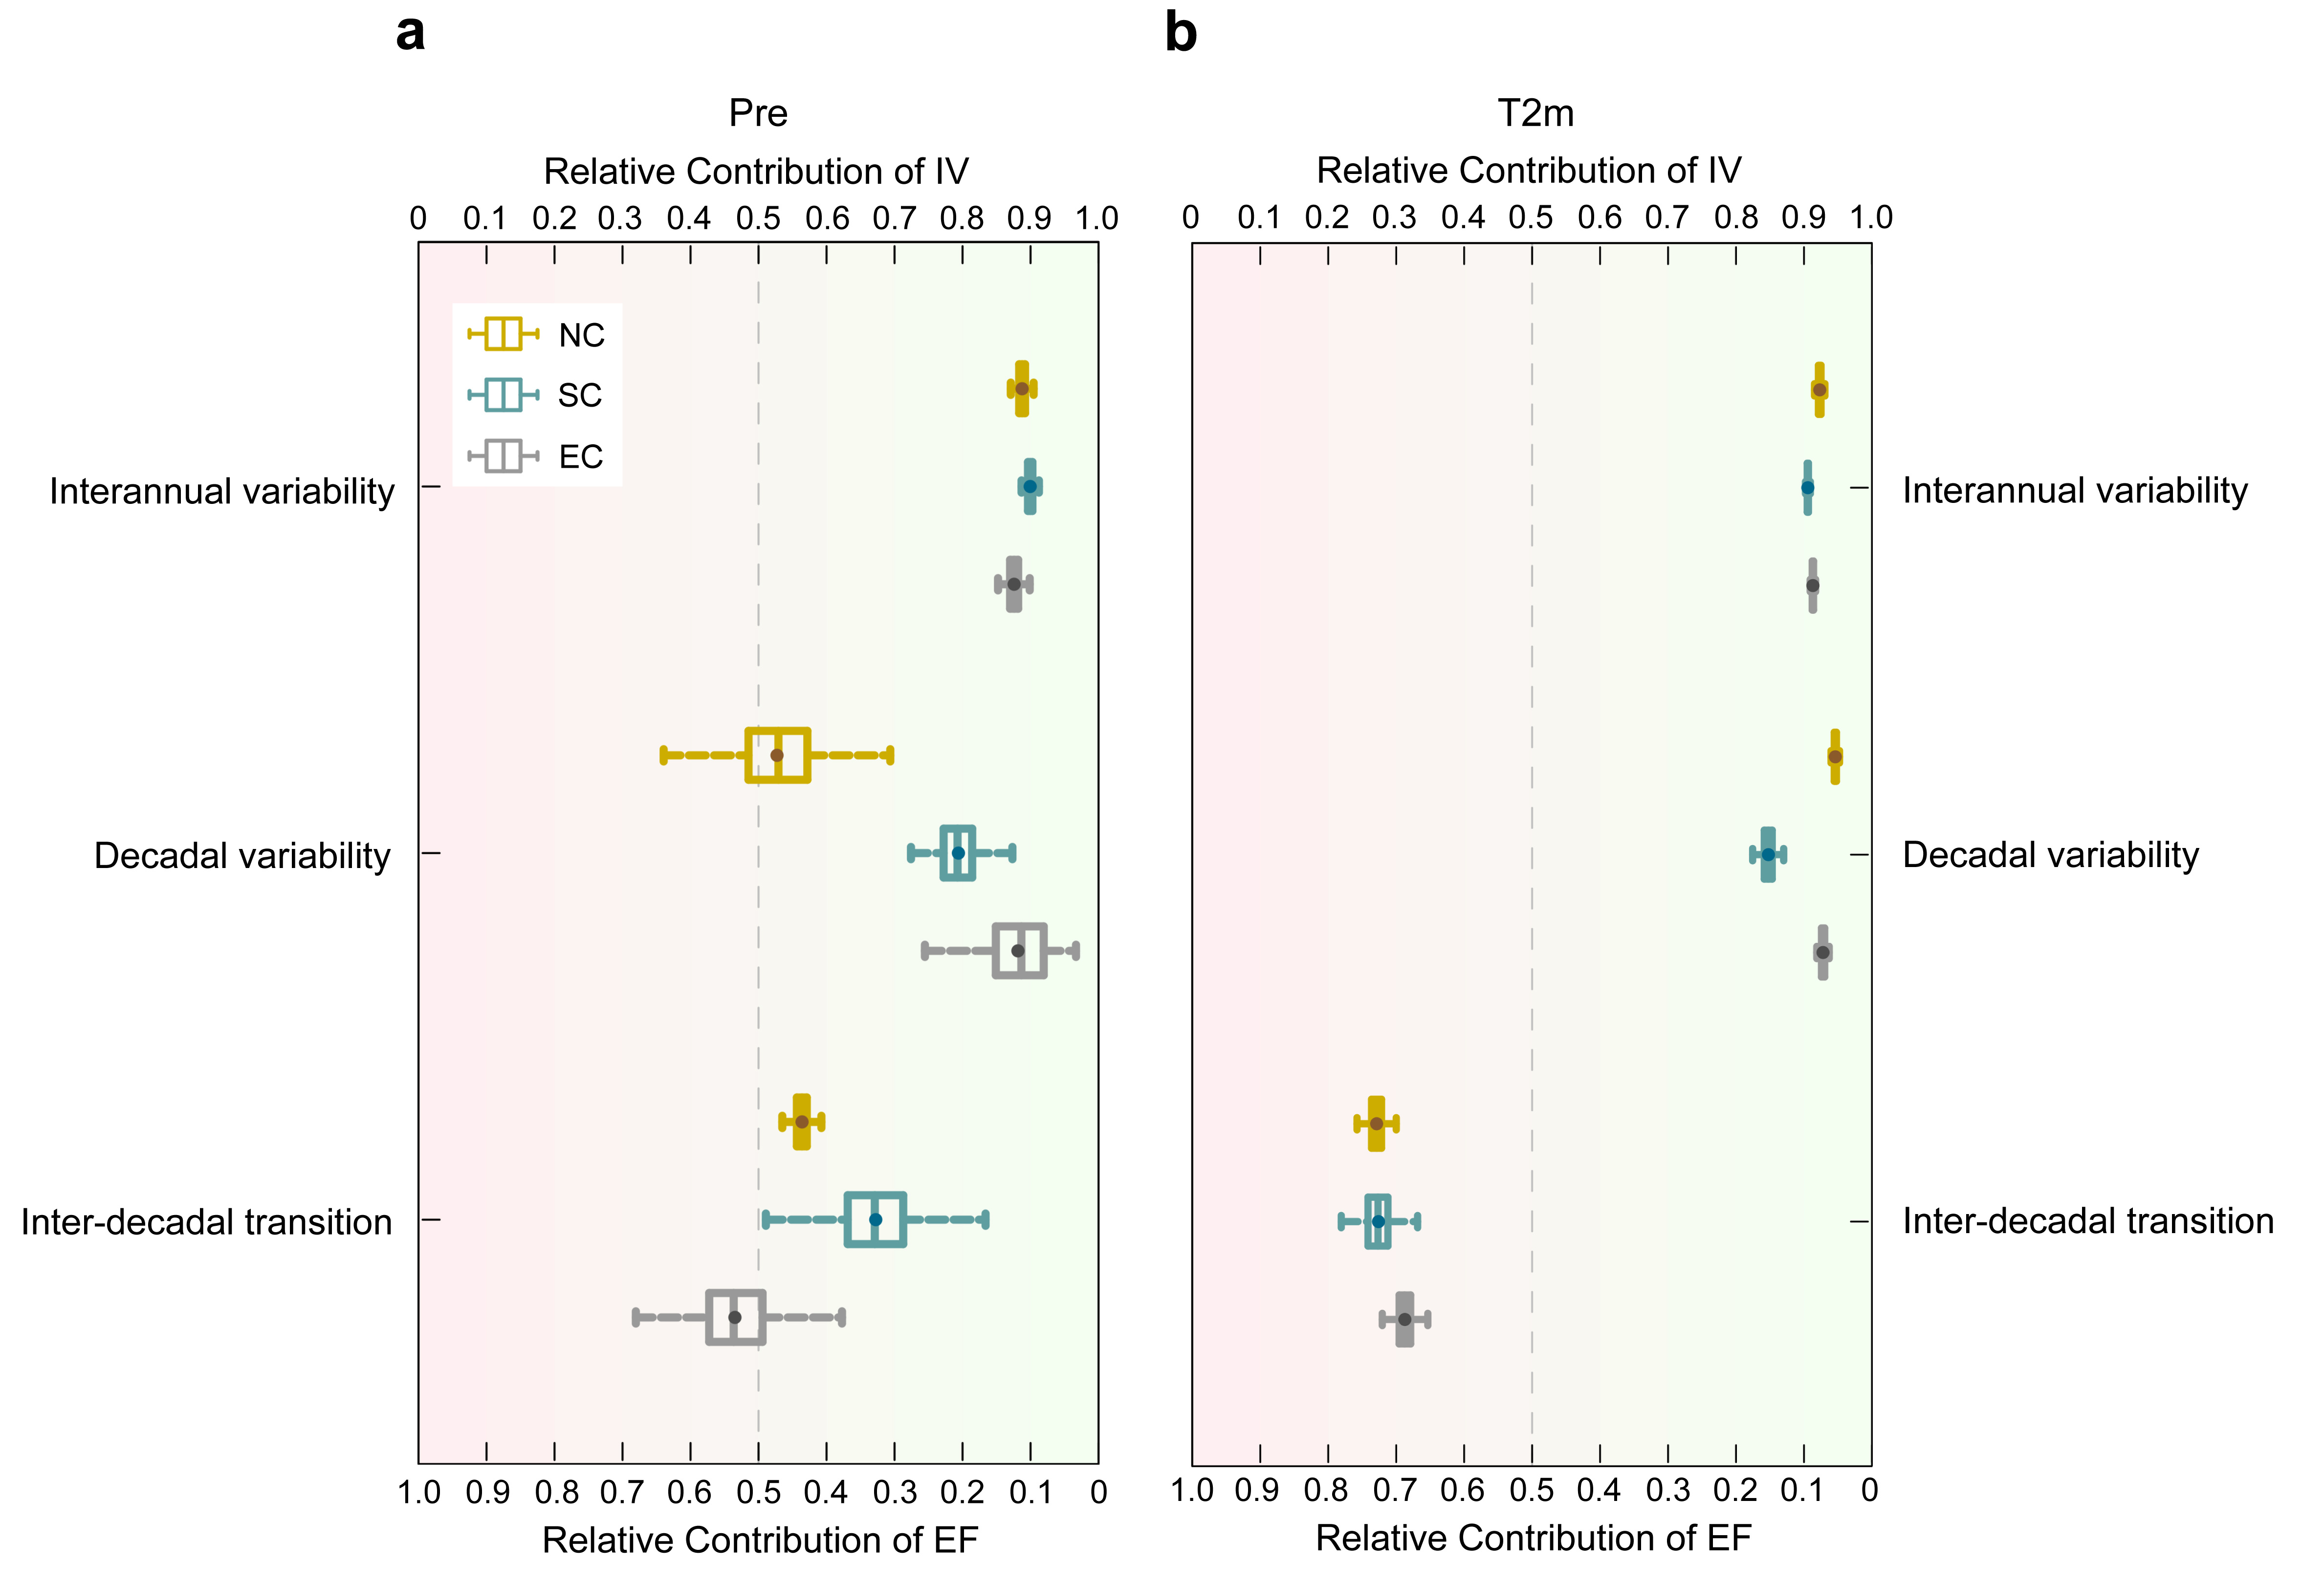
We further quantified the relative contributions of internal and external forcing to the dipole climate pattern using a relative weight analysis method (Fig. 2). The internal climate variability accounted for about 65% (55%) of the inter-decadal transition in anomalous precipitation in South (North) China during the second half of the 20th century. The internal climate variability clearly dominates the inter-decadal transition in precipitation over South China. However, both the internal climate variability and external forcing have important roles in determining drying tendency in North China. In terms of the changes in the annual mean surface air temperature, external forcing accounts for 70% of the warming trend over North China. By contrast, the internal variability dominates the cooling trend of the summer surface air temperature over the Yangtze River basin.
This study proposed an approach combining a large ensemble mean of global climate models and regional model simulations to separate the response of the regional climate to internal climate variability from external forcing. It provides a novel framework for the attribution of regional climate change that could also be applied to other regions, such as North America and northeastern Australia.
Follow the Topic
-
npj Climate and Atmospheric Science

This journal is dedicated to publishing research on topics such as climate dynamics and variability, weather and climate prediction, climate change, weather extremes, air pollution, atmospheric chemistry, the hydrological cycle and atmosphere-ocean and -land interactions.
Related Collections
With Collections, you can get published faster and increase your visibility.
Modeling of Airborne Composition and Concentrations
Publishing Model: Open Access
Deadline: Mar 31, 2026
Inter-Basin Dynamics: Cross-Ocean Interactions and Decadal Forecasting
Publishing Model: Open Access
Deadline: Apr 30, 2026

Please sign in or register for FREE
If you are a registered user on Research Communities by Springer Nature, please sign in