Putting together the puzzle of Arctic thaw slumps
Published in Earth & Environment
Why Study Thawing Arctic Ground?
Think of the Arctic as Earth's freezer - it contains vast amounts of frozen ground (permafrost) that is now thawing as temperatures rise. When this happens, some areas collapse dramatically, creating landscape features called retrogressive thaw slumps (RTS). These collapses aren't just changing how the Arctic looks - they're releasing greenhouse gases that were previously locked in the frozen ground for thousands of years, accelerating climate change. Thaw slumps can also damage roads, buildings, and cultural sites, directly affecting Arctic communities.

The Challenge We Faced
Despite their importance, we had a big problem: no one knew exactly where all these thaw slumps were across the Arctic. Different research teams had mapped them in various locations, but this information was scattered across many separate studies using different formats and methods. It's like having pieces of a puzzle stored in different boxes - you can't see the full picture until you bring them all together.
Our Solution: Creating a Master Dataset
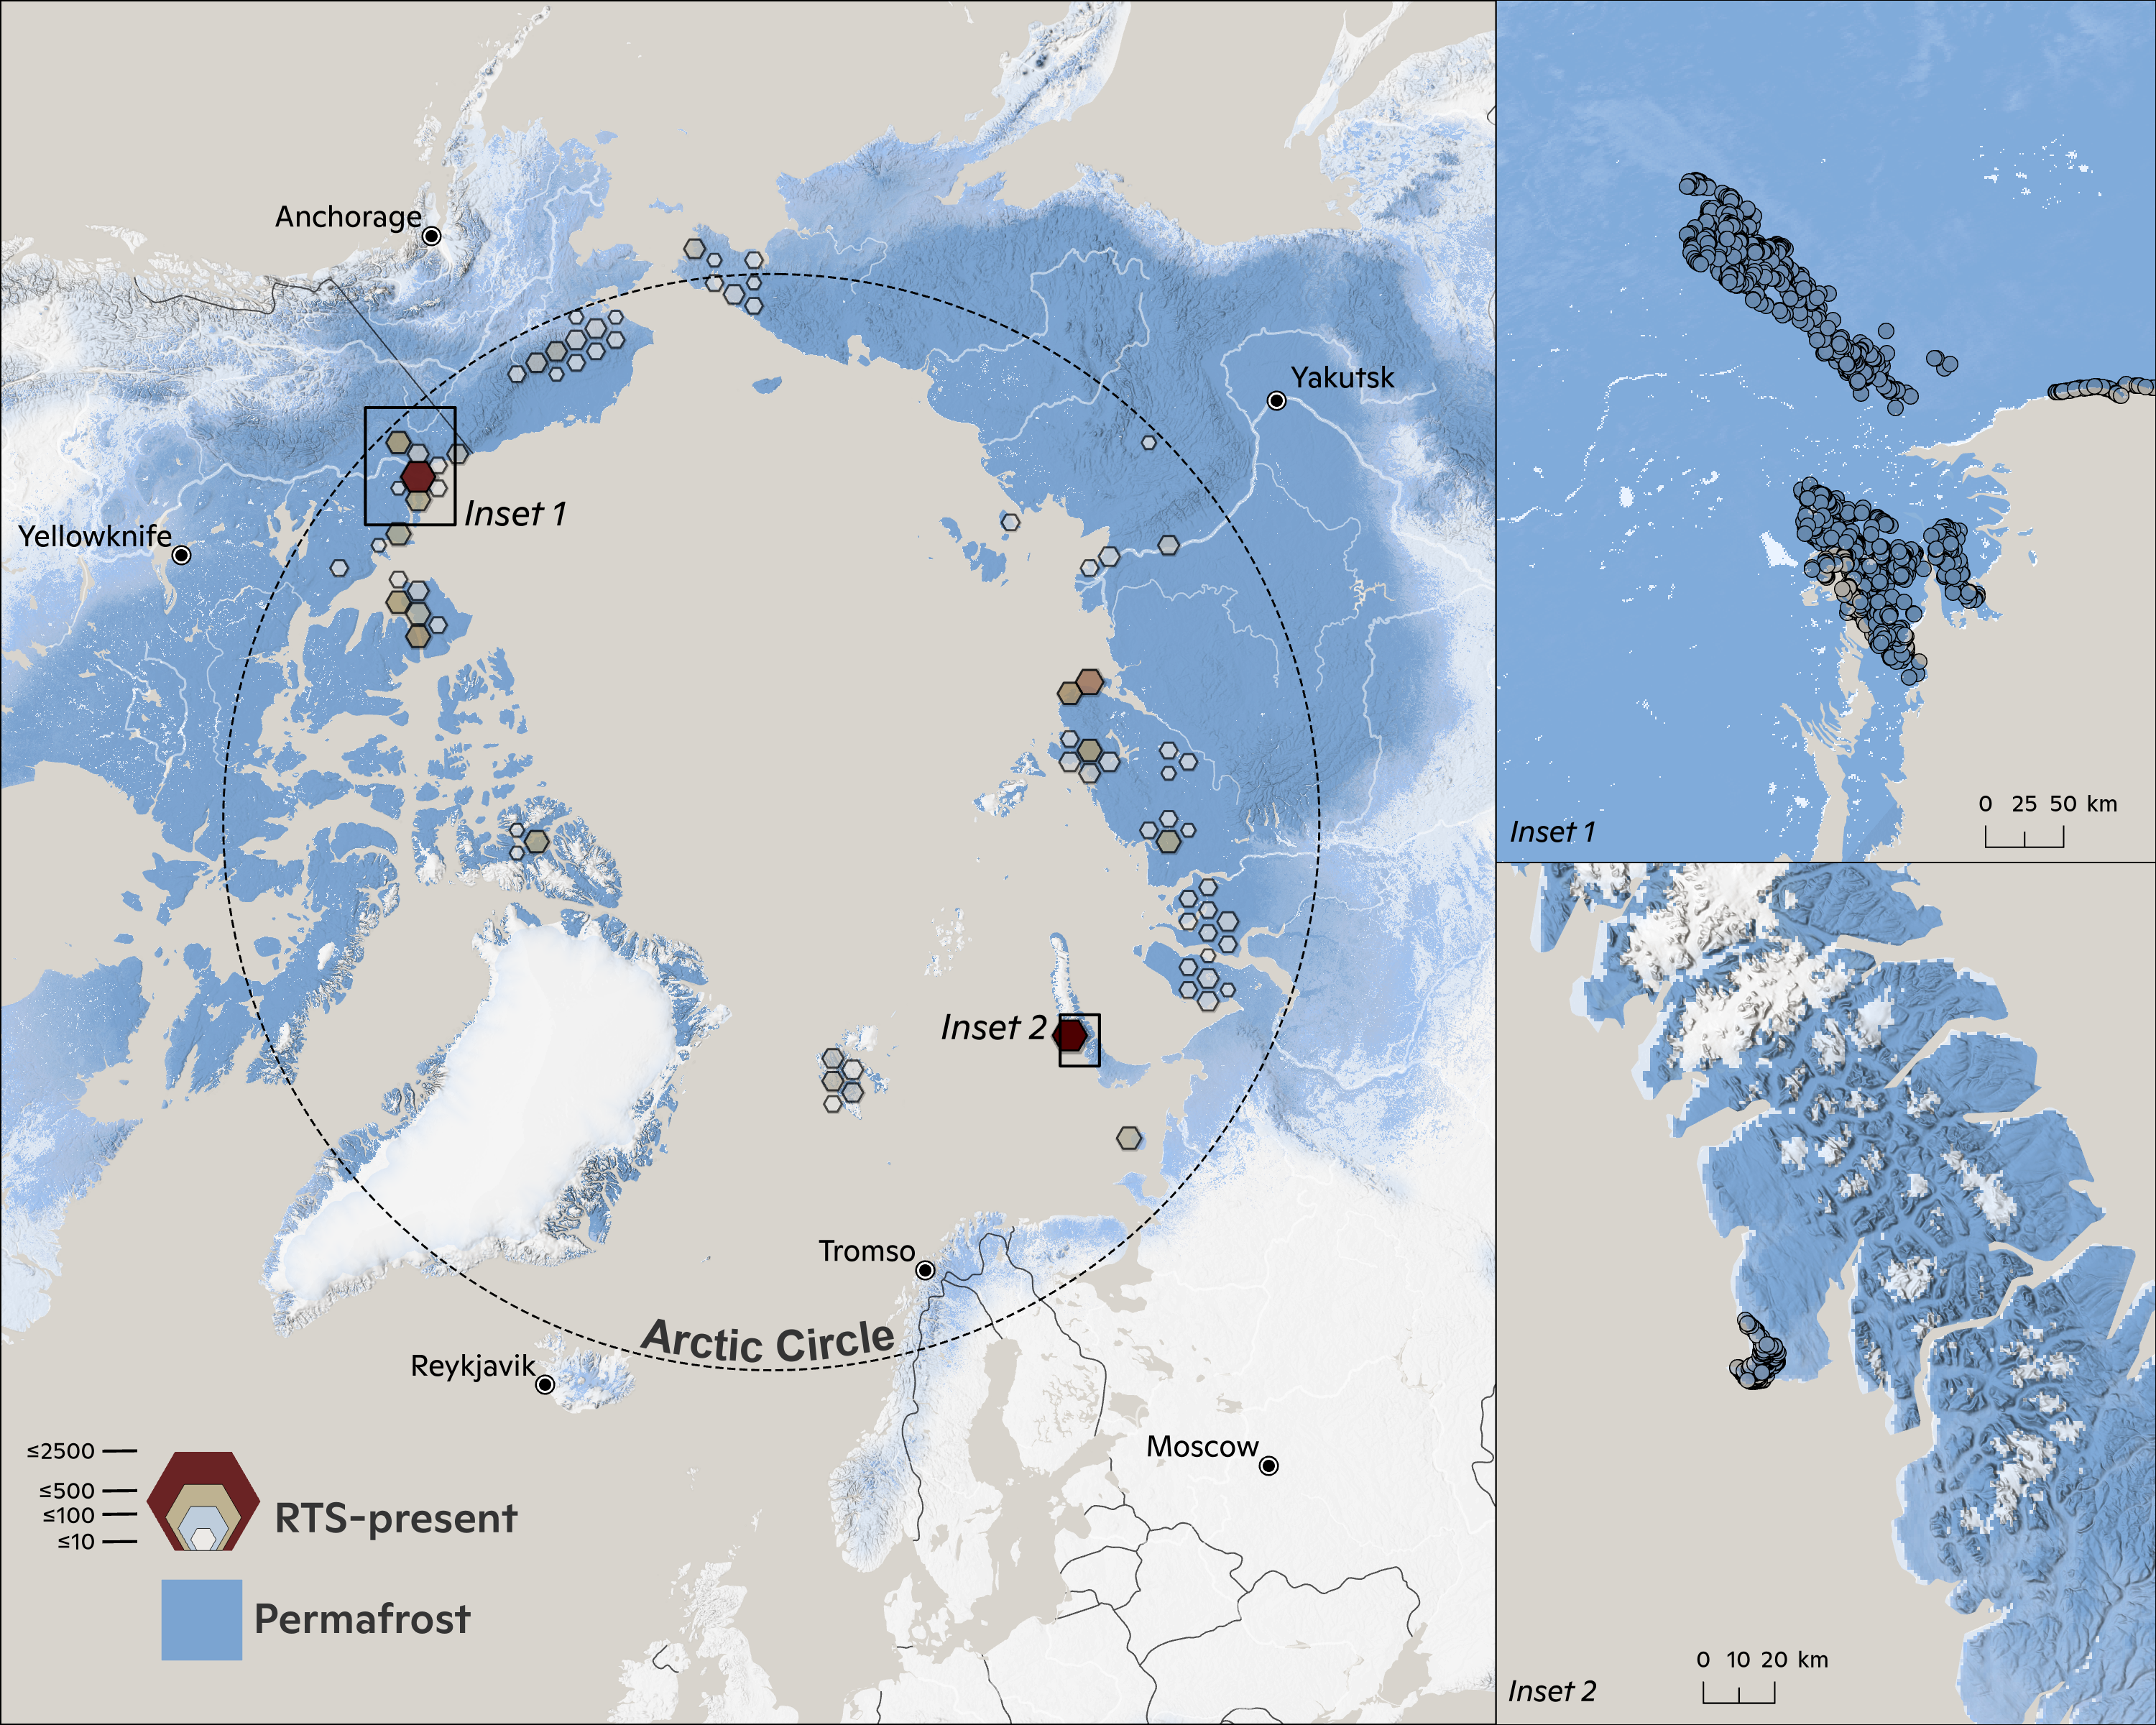
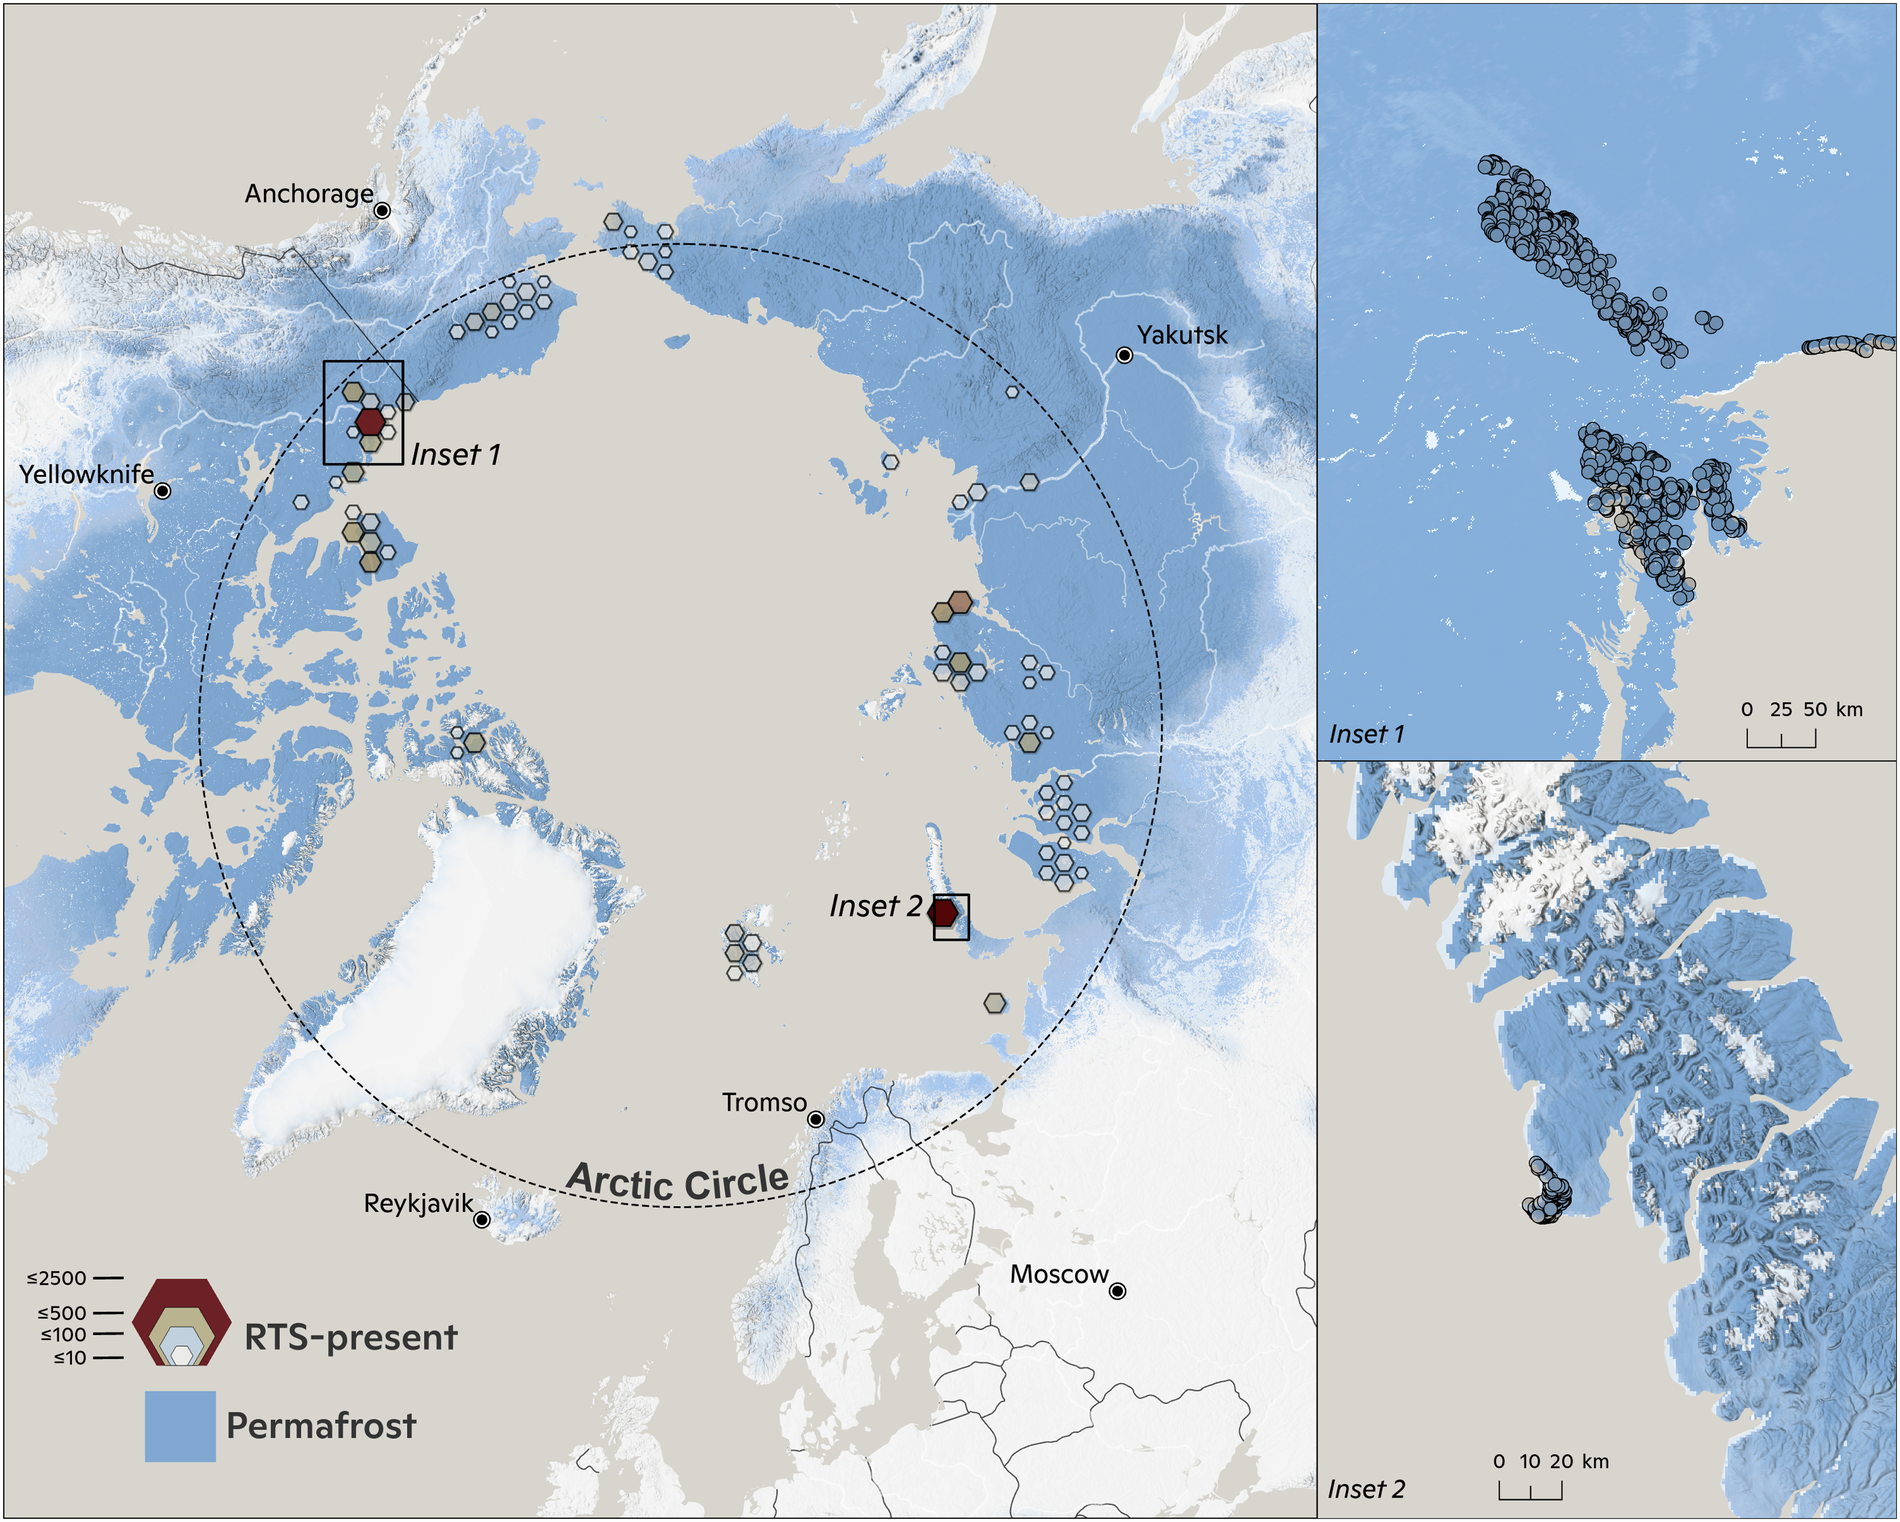
We addressed this problem by creating one comprehensive dataset - the Arctic Retrogressive Thaw Slumps (ARTS) dataset. We worked with research teams from around the world to combine their maps and observations. The result is a collection of over 23,500 confirmed thaw slumps and 20,400 locations where we confirmed there weren't any slumps.
These features aren't evenly spread across the Arctic - they tend to cluster in "hotspots" where the local conditions make thaw slumps more likely to form. This clustering happens because the Arctic landscape varies greatly from place to place - some areas have the right mix of ground ice, slope, and soil types that make them more prone to developing thaw slumps. Our dataset covers these major hotspot regions across Siberia, Canada, Alaska, and other Arctic areas, helping us understand where and why these features form.
How We Built It
Building this dataset was like creating a universal language for thaw slump research. We developed clear standards for how to record and describe each thaw slump. We gave each one a unique ID (think of it like wildlife tracking) so we could track changes over time - whether they grow larger, merge with others, or form new ones in the same spot. We carefully checked the quality of each contribution and made the data are easy to access and use. To make this data truly accessible, we stored it in an open format called GeoJSON that works with most mapping software, created clear documentation and tutorials, and shared everything through GitHub - a platform where researchers can easily download the data and suggest improvements. This accessibility is crucial because science works best when everyone can access, use, and build upon each other's work.
Why This Matters
Having all this information in one place, in a consistent format, is a game-changer. Scientists can now more easily study how these thaw slumps are changing across the entire Arctic. The dataset helps train mapping algorithms to automatically detect new thaw slumps from satellite images, making it easier to monitor changes. This information is crucial for scientists studying permafrost and climate change impacts, and has the potential to inform Arctic community infrastructure planning and adaptation measures.
Setting Standards for Future Research
We didn't just want to collect data - we wanted to make it easier for future researchers to add their observations. That's why we created clear guidelines for how to format and contribute new information. Think of it like establishing standard rules for a game - when everyone follows the same rules, it's easier to play together.
Our guidelines include specific instructions for recording important details like when and where a thaw slump was observed, by whom, what satellite images were used to map it, and how to track if it merges with other slumps over time. Making this process straightforward is crucial because thaw slumps are appearing more frequently as the Arctic warms, and we need many researchers working together to keep track of these rapid changes.
An Invitation to Join Us
This is just the beginning. We've created tools and tutorials on GitHub to help researchers use and contribute to the dataset. Whether you're a scientist studying the Arctic or someone interested in climate change, we invite you to explore this resource. The Arctic is changing rapidly, and by working together to track these changes we can better understand and prepare for the future.
The more we know about how the Arctic is changing, the better we can protect both the environment and the communities that call it home. We hope this dataset will help bring the research community together to tackle one of the most pressing challenges of our time - understanding and adapting to rapid Arctic change.
By maintaining and expanding this dataset together, we can better understand how the Arctic is transforming and what it means for our planet's future. We invite you to be part of this effort - whether by using the data in your research or contributing new observations to help complete the Arctic puzzle.
Follow the Topic
-
Scientific Data
A peer-reviewed, open-access journal for descriptions of datasets, and research that advances the sharing and reuse of scientific data.

Related Collections
With Collections, you can get published faster and increase your visibility.
Computer vision in plant science and agriculture
Publishing Model: Open Access
Deadline: Oct 10, 2026
Wearable and Computer Vision Data for Health and Behaviour Research
Publishing Model: Open Access
Deadline: Aug 08, 2026

Please sign in or register for FREE
If you are a registered user on Research Communities by Springer Nature, please sign in